| Red | Green | Blue | |
| z | 17.63 | ||
| znorm | Inf | ||
| sky | -NaN | -NaN | -Inf |
| S/N | 25.4 | 43.6 | 50.4 |
| S/N(c) | 0.0 | 0.0 | 0.0 |
| SN(E/C) |
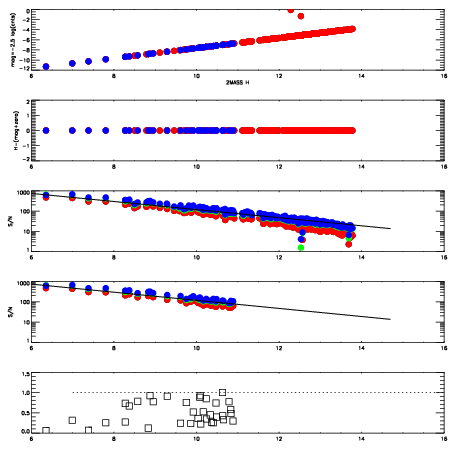
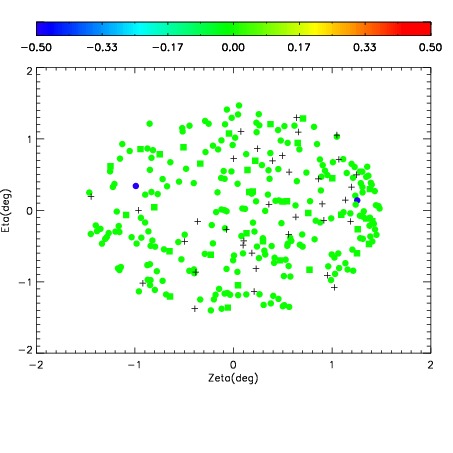

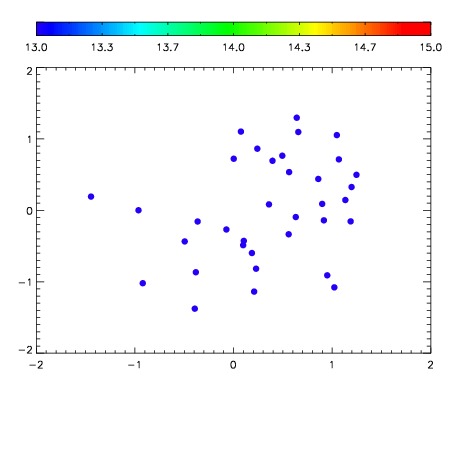

| Frame | Nreads | Zeropoints | Mag plots | Spatial mag deviation | Spatial sky 16325A emission deviations (filled: sky, open: star) | Spatial sky continuum emission | Spatial sky telluric CO2 absorption deviations (filled: H < 10) | |||||||||||||||||||||||
| 0 | 0 |
|
|
|
|
|
|
| IPAIR | NAME | SHIFT | NEWSHIFT | S/N | NAME | SHIFT | NEWSHIFT | S/N |
| 0 | 05260015 | 0.485879 | 0.00000 | 18.9717 | 05260020 | 0.000193414 | 0.485686 | 18.9763 |
| 1 | 05260019 | 0.485252 | 0.000627011 | 18.9895 | 05260013 | 0.00000 | 0.485879 | 18.9917 |
| 2 | 05260018 | 0.485063 | 0.000816017 | 18.9393 | 05260017 | -0.000467343 | 0.486346 | 18.9359 |
| 3 | 05260014 | 0.485341 | 0.000537992 | 18.8761 | 05260016 | 0.000830678 | 0.485048 | 18.9165 |