| Red | Green | Blue | |
| z | 17.63 | ||
| znorm | Inf | ||
| sky | -NaN | -NaN | -Inf |
| S/N | 18.0 | 24.5 | 18.3 |
| S/N(c) | 0.0 | 0.0 | 0.0 |
| SN(E/C) |
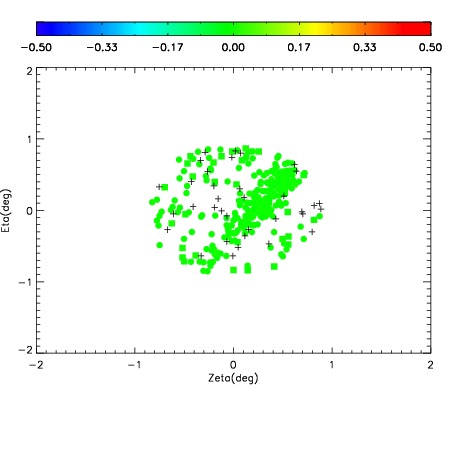
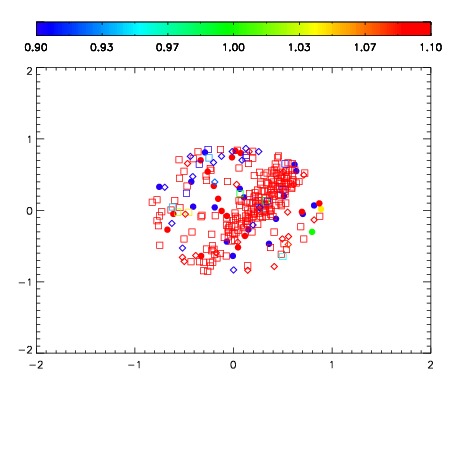
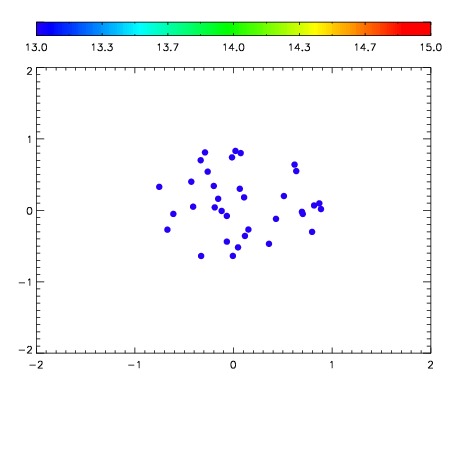

| Frame | Nreads | Zeropoints | Mag plots | Spatial mag deviation | Spatial sky 16325A emission deviations (filled: sky, open: star) | Spatial sky continuum emission | Spatial sky telluric CO2 absorption deviations (filled: H < 10) | |||||||||||||||||||||||
| 0 | 0 |
|
|
|
|
|
|
| IPAIR | NAME | SHIFT | NEWSHIFT | S/N | NAME | SHIFT | NEWSHIFT | S/N |
| 0 | 08180058 | 0.508946 | 0.00000 | 17.1850 | 08180059 | 0.000511989 | 0.508434 | 17.8715 |
| 1 | 08180057 | 0.502849 | 0.00609702 | 18.7562 | 08180056 | 0.00000 | 0.508946 | 18.7190 |
| 2 | 08180061 | 0.504728 | 0.00421798 | 18.6725 | 08180060 | -0.000422625 | 0.509369 | 18.0991 |