| Red | Green | Blue | |
| z | 17.63 | ||
| znorm | Inf | ||
| sky | -NaN | -NaN | -NaN |
| S/N | 24.2 | 32.0 | 22.9 |
| S/N(c) | 0.0 | 0.0 | 0.0 |
| SN(E/C) |
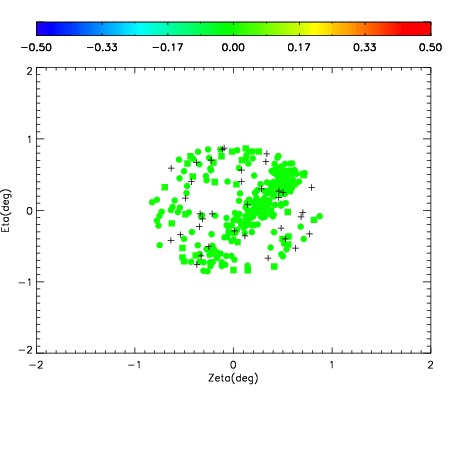
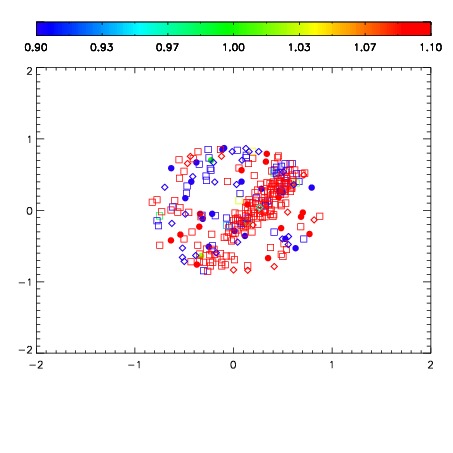


| Frame | Nreads | Zeropoints | Mag plots | Spatial mag deviation | Spatial sky 16325A emission deviations (filled: sky, open: star) | Spatial sky continuum emission | Spatial sky telluric CO2 absorption deviations (filled: H < 10) | |||||||||||||||||||||||
| 0 | 0 |
|
|
|
|
|
|
| IPAIR | NAME | SHIFT | NEWSHIFT | S/N | NAME | SHIFT | NEWSHIFT | S/N |
| 0 | 08320012 | 0.521387 | 0.00000 | 18.6350 | 08320013 | 0.00217185 | 0.519215 | 18.7729 |
| 1 | 08320015 | 0.520556 | 0.000831008 | 18.8383 | 08320014 | 0.00148558 | 0.519901 | 18.8220 |
| 2 | 08320011 | 0.520604 | 0.000782967 | 18.4393 | 08320010 | 0.00000 | 0.521387 | 18.5459 |