| Frame | Nreads | Zeropoints | Mag plots
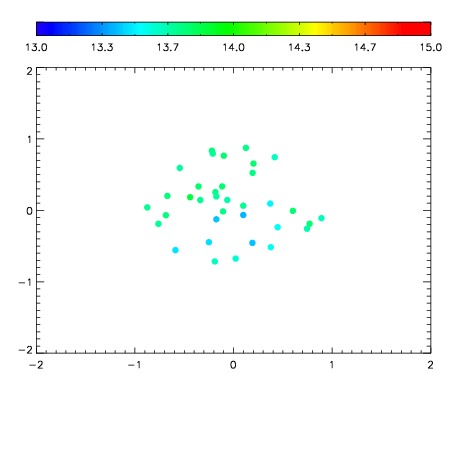
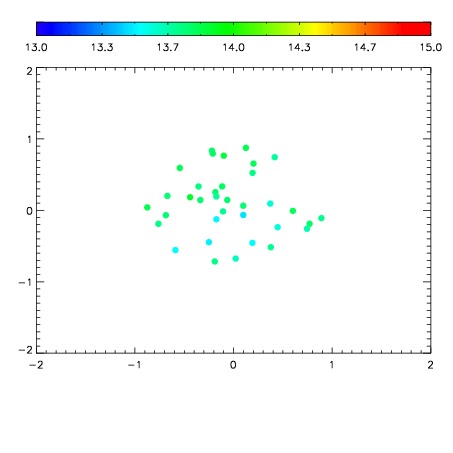
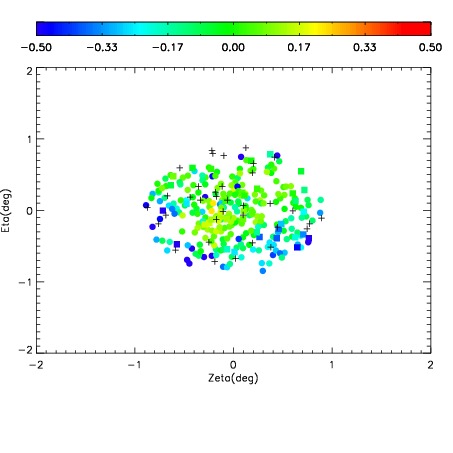
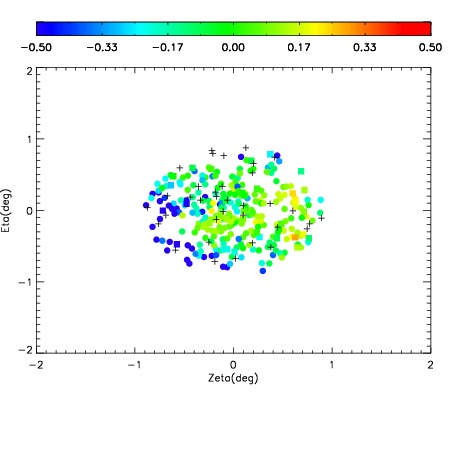
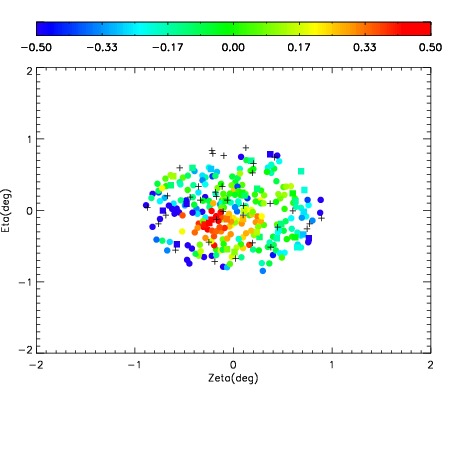
| Spatial mag deviation
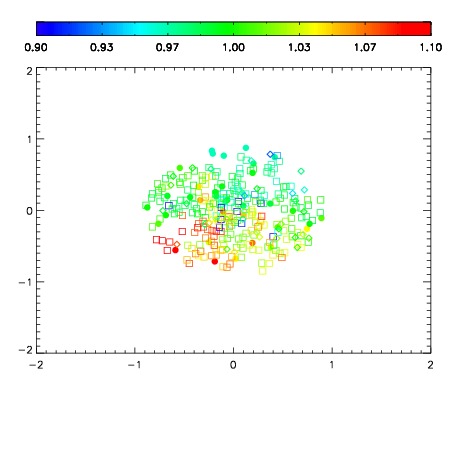
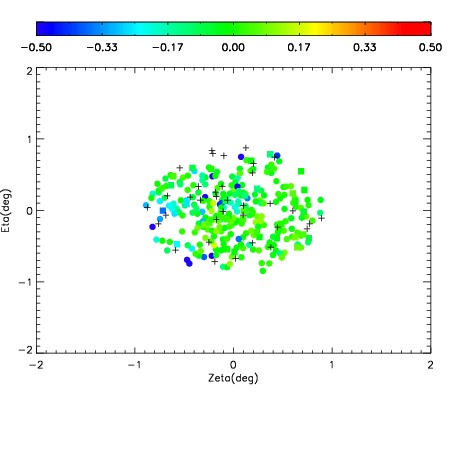
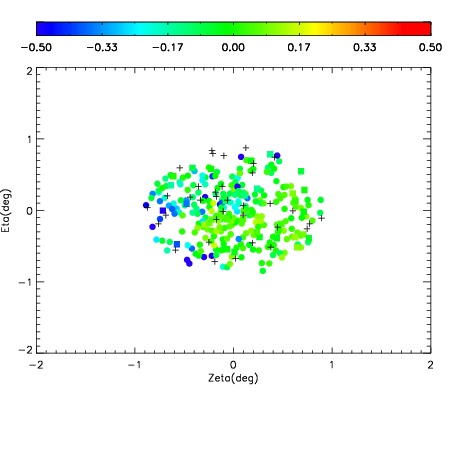
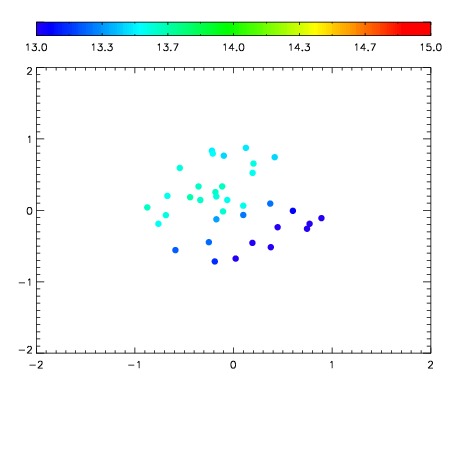
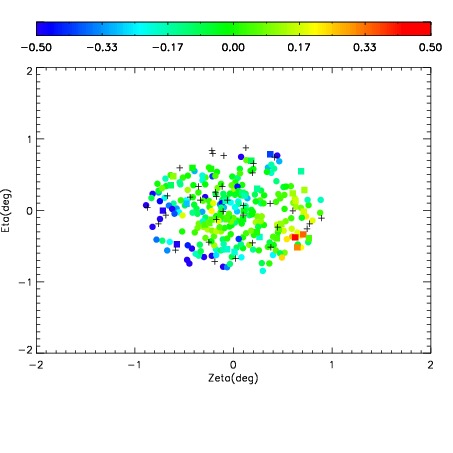
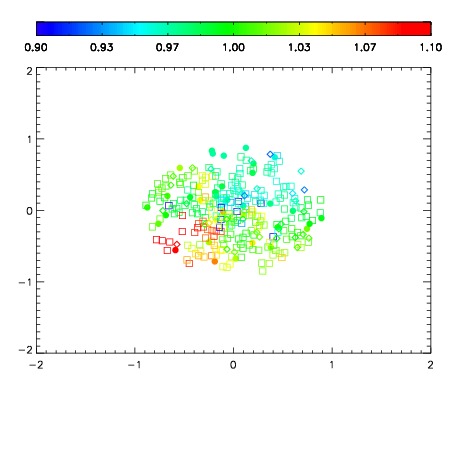
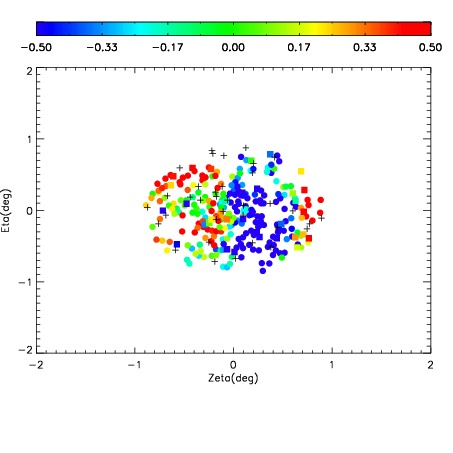
| Spatial sky 16325A emission deviations (filled: sky, open: star)
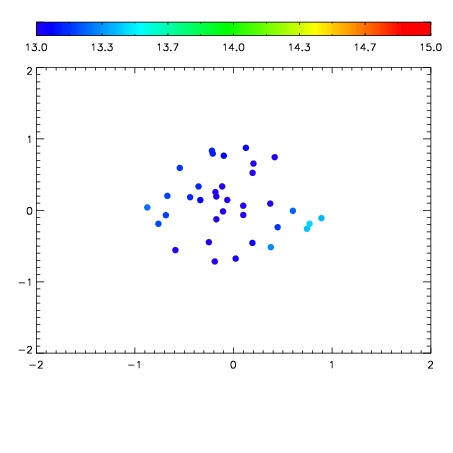
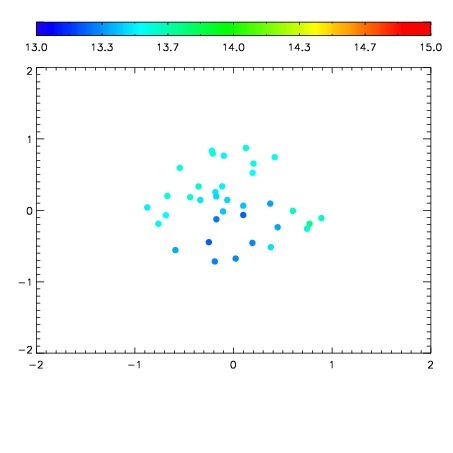
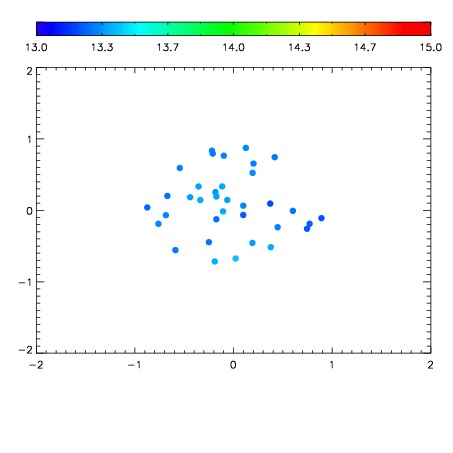
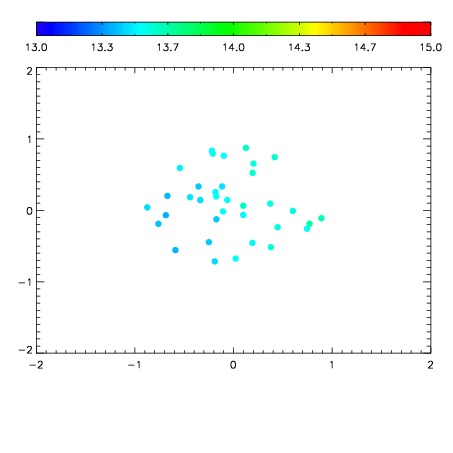
| Spatial sky continuum emission
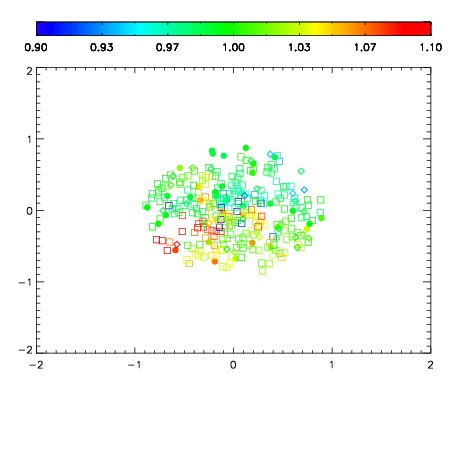
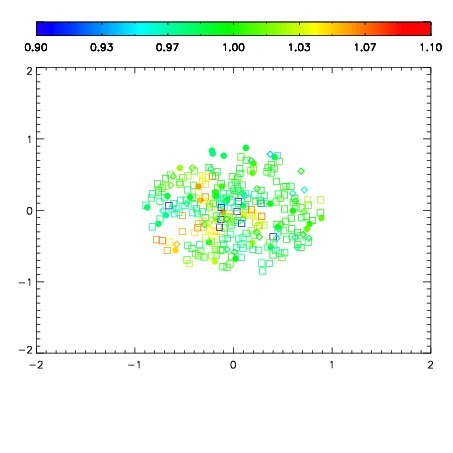
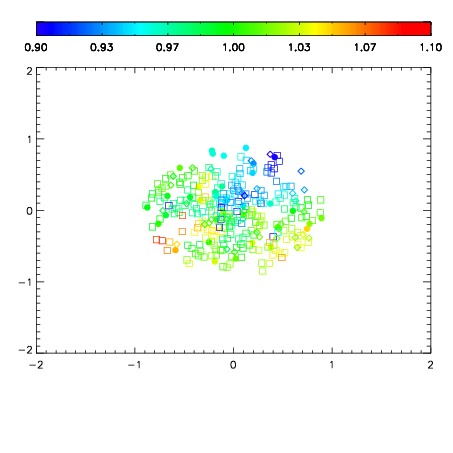
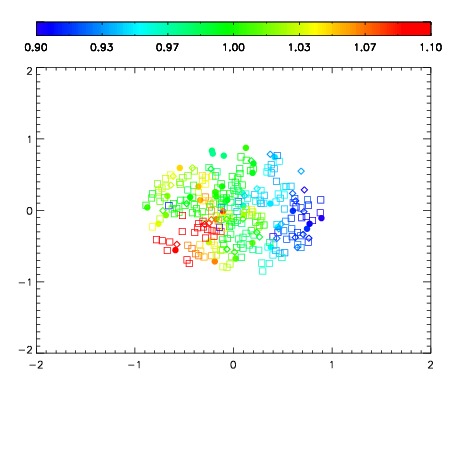
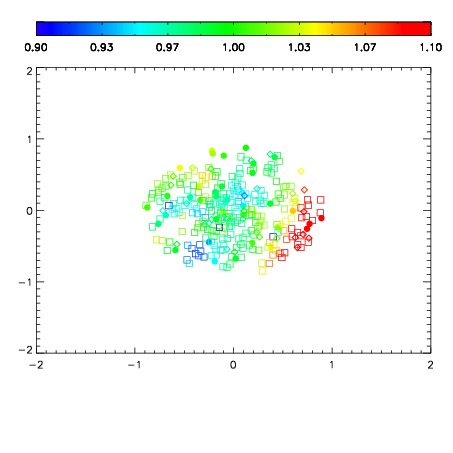
| Spatial sky telluric CO2 absorption deviations (filled: H < 10)
|
| 5180055
| 47
| | Red | Green | Blue
| | z | | 19.08
| | znorm | | 14.90
| | sky | 13.9 | 13.7 | 13.7
| | S/N | 15.7 | 24.2 | 24.8
| | S/N(c) | 14.8 | 22.6 | 21.4
| | SN(E/C) 0.95
|
| 
| 
| 
| 
| 
|
| 5180056
| 47
| | Red | Green | Blue
| | z | | 19.13
| | znorm | | 14.95
| | sky | 13.9 | 13.7 | 13.8
| | S/N | 16.1 | 24.9 | 26.1
| | S/N(c) | 15.4 | 23.5 | 22.5
| | SN(E/C) 0.98
|
| 
| 
| 
| 
| 
|
| 5180057
| 47
| | Red | Green | Blue
| | z | | 19.06
| | znorm | | 14.88
| | sky | 13.8 | 13.7 | 13.8
| | S/N | 15.4 | 24.0 | 24.9
| | S/N(c) | 14.4 | 22.2 | 21.2
| | SN(E/C) 0.94
|
| 
| 
| 
| 
| 
|
| 5180058
| 47
| | Red | Green | Blue
| | z | | 18.89
| | znorm | | 14.71
| | sky | 13.6 | 13.5 | 13.5
| | S/N | 13.3 | 20.7 | 21.7
| | S/N(c) | 12.5 | 19.5 | 18.9
| | SN(E/C) 0.95
|
| 
| 
| 
| 
| 
|
| 5180059
| 47
| | Red | Green | Blue
| | z | | 18.45
| | znorm | | 14.27
| | sky | 13.1 | 13.1 | 13.1
| | S/N | 9.4 | 14.9 | 16.3
| | S/N(c) | 9.0 | 14.5 | 13.8
| | SN(E/C) 1.03
|
| 
| 
| 
| 
| 
|
| 5180060
| 47
| | Red | Green | Blue
| | z | | 18.79
| | znorm | | 14.61
| | sky | 13.6 | 13.5 | 13.5
| | S/N | 12.5 | 19.7 | 20.9
| | S/N(c) | 11.7 | 18.7 | 17.8
| | SN(E/C) 0.94
|
| 
| 
| 
| 
| 
|
| 5180061
| 47
| | Red | Green | Blue
| | z | | 17.32
| | znorm | | 13.14
| | sky | 13.4 | 13.3 | 13.3
| | S/N | 3.5 | 6.8 | 7.0
| | S/N(c) | 3.7 | 6.7 | 6.7
| | SN(E/C) 1.08
|
| 
| 
| 
| 
| 
|
| 5180062
| 47
| | Red | Green | Blue
| | z | | 15.50
| | znorm | | 11.32
| | sky | 13.6 | 13.5 | 13.6
| | S/N | 0.5 | 1.4 | 1.5
| | S/N(c) | 0.6 | 1.5 | 1.6
| | SN(E/C) 1.06
|
| 
| 
| 
| 
| 
|