| Red | Green | Blue | |
| z | 17.64 | ||
| znorm | Inf | ||
| sky | -Inf | -Inf | -Inf |
| S/N | 20.3 | 32.7 | 35.4 |
| S/N(c) | 0.0 | 0.0 | 0.0 |
| SN(E/C) |
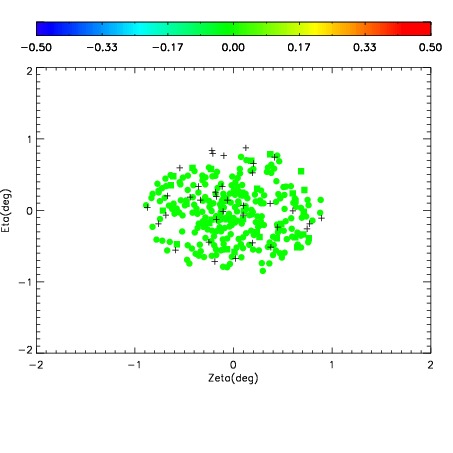
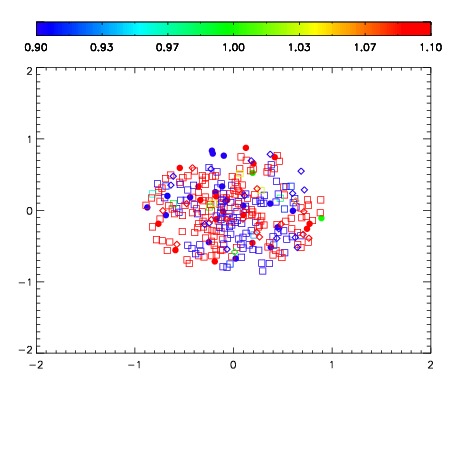
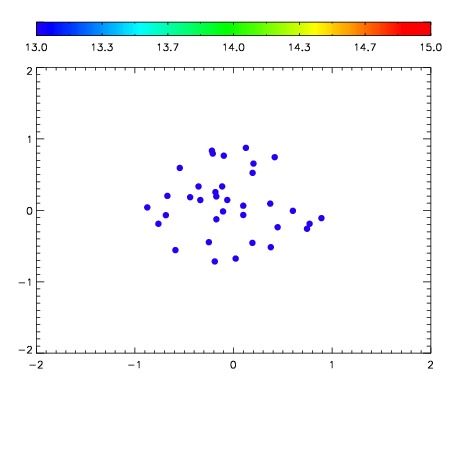

| Frame | Nreads | Zeropoints | Mag plots | Spatial mag deviation | Spatial sky 16325A emission deviations (filled: sky, open: star) | Spatial sky continuum emission | Spatial sky telluric CO2 absorption deviations (filled: H < 10) | |||||||||||||||||||||||
| 0 | 0 |
|
|
|
|
|
|
| IPAIR | NAME | SHIFT | NEWSHIFT | S/N | NAME | SHIFT | NEWSHIFT | S/N |
| 0 | 05180057 | 0.503552 | 0.00000 | 19.0472 | 05180058 | 0.00144563 | 0.502106 | 18.8509 |
| 1 | 05180056 | 0.497035 | 0.00651702 | 19.1254 | 05180055 | 0.00000 | 0.503552 | 19.0686 |
| 2 | 05180060 | 0.496970 | 0.00658202 | 18.7571 | 05180059 | 0.00112590 | 0.502426 | 18.4292 |
| 3 | 05180061 | 0.497329 | 0.00622302 | 17.2903 | 05180062 | 0.00312654 | 0.500425 | 15.3022 |