| Red | Green | Blue | |
| z | 17.64 | ||
| znorm | Inf | ||
| sky | -Inf | -Inf | -NaN |
| S/N | 25.9 | 43.3 | 45.5 |
| S/N(c) | 0.0 | 0.0 | 0.0 |
| SN(E/C) |
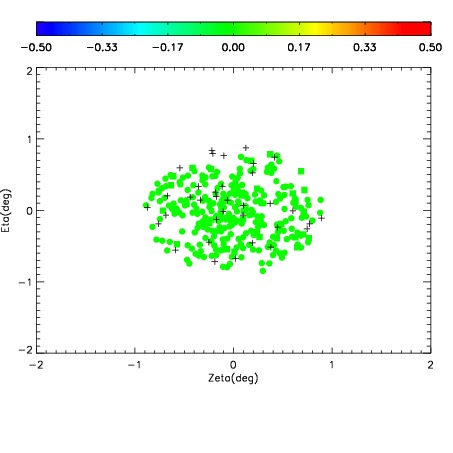
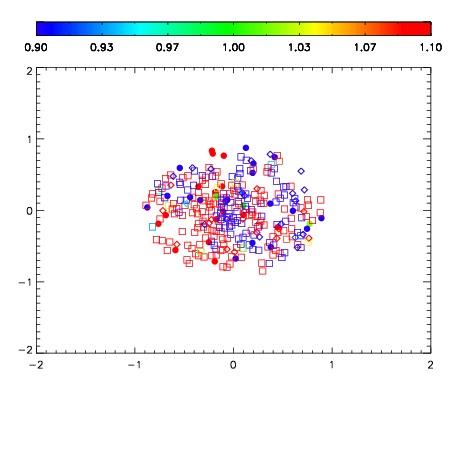


| Frame | Nreads | Zeropoints | Mag plots | Spatial mag deviation | Spatial sky 16325A emission deviations (filled: sky, open: star) | Spatial sky continuum emission | Spatial sky telluric CO2 absorption deviations (filled: H < 10) | |||||||||||||||||||||||
| 0 | 0 |
|
|
|
|
|
|
| IPAIR | NAME | SHIFT | NEWSHIFT | S/N | NAME | SHIFT | NEWSHIFT | S/N |
| 0 | 05250028 | 0.489737 | 0.00000 | 18.9544 | 05250033 | 0.00224581 | 0.487491 | 18.9521 |
| 1 | 05250031 | 0.489357 | 0.000380009 | 19.0650 | 05250026 | 0.00000 | 0.489737 | 19.0353 |
| 2 | 05250032 | 0.489163 | 0.000573993 | 19.0401 | 05250029 | -0.000188165 | 0.489925 | 19.0338 |
| 3 | 05250027 | 0.488708 | 0.00102901 | 19.0096 | 05250030 | 0.00178960 | 0.487947 | 19.0328 |