| Red | Green | Blue | |
| z | 17.64 | ||
| znorm | Inf | ||
| sky | -NaN | -Inf | -Inf |
| S/N | 20.1 | 35.8 | 36.9 |
| S/N(c) | 0.0 | 0.0 | 0.0 |
| SN(E/C) |
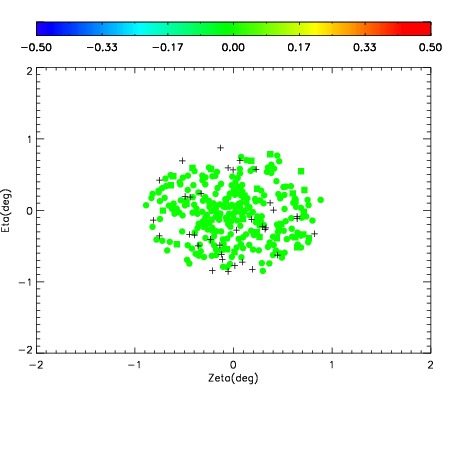
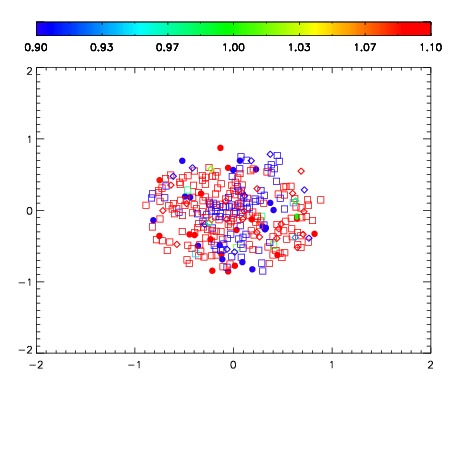


| Frame | Nreads | Zeropoints | Mag plots | Spatial mag deviation | Spatial sky 16325A emission deviations (filled: sky, open: star) | Spatial sky continuum emission | Spatial sky telluric CO2 absorption deviations (filled: H < 10) | |||||||||||||||||||||||
| 0 | 0 |
|
|
|
|
|
|
| IPAIR | NAME | SHIFT | NEWSHIFT | S/N | NAME | SHIFT | NEWSHIFT | S/N |
| 0 | 05440043 | 0.484378 | 0.00000 | 18.6111 | 05440041 | -0.00152326 | 0.485901 | 18.4759 |
| 1 | 05440046 | 0.482123 | 0.00225502 | 18.7117 | 05440045 | -0.00157234 | 0.485950 | 18.6336 |
| 2 | 05440042 | 0.483439 | 0.000939012 | 18.6275 | 05440044 | -0.000356340 | 0.484734 | 18.5613 |
| 3 | 05440039 | 0.482648 | 0.00173002 | 18.4906 | 05440040 | -0.00246529 | 0.486843 | 18.4426 |
| 4 | 05440038 | 0.482867 | 0.00151101 | 18.3656 | 05440037 | 0.00000 | 0.484378 | 18.3403 |