| Red | Green | Blue | |
| z | 17.64 | ||
| znorm | Inf | ||
| sky | -Inf | -Inf | -Inf |
| S/N | 24.2 | 40.1 | 41.5 |
| S/N(c) | 0.0 | 0.0 | 0.0 |
| SN(E/C) |
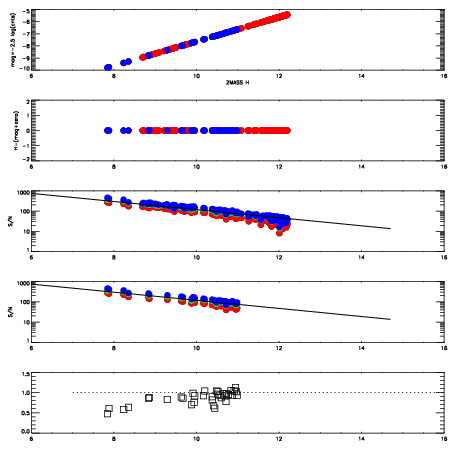
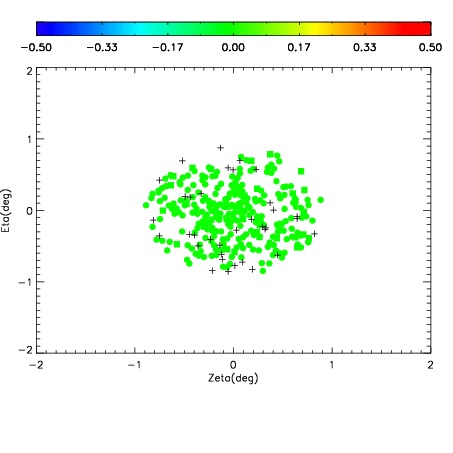
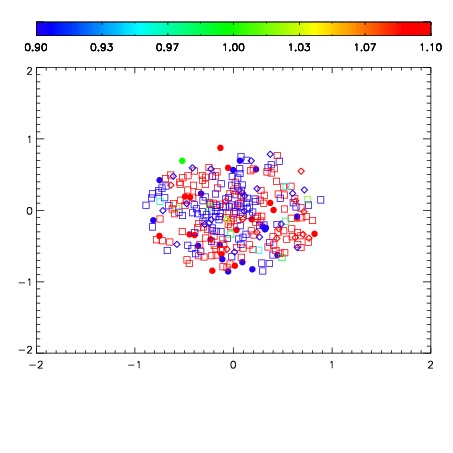
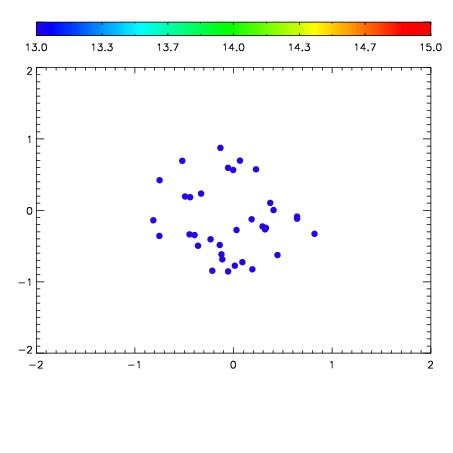

| Frame | Nreads | Zeropoints | Mag plots | Spatial mag deviation | Spatial sky 16325A emission deviations (filled: sky, open: star) | Spatial sky continuum emission | Spatial sky telluric CO2 absorption deviations (filled: H < 10) | |||||||||||||||||||||||
| 0 | 0 |
|
|
|
|
|
|
| IPAIR | NAME | SHIFT | NEWSHIFT | S/N | NAME | SHIFT | NEWSHIFT | S/N |
| 0 | 06020017 | 0.490686 | 0.00000 | 18.7108 | 06020018 | 0.000766928 | 0.489919 | 18.7820 |
| 1 | 06020013 | 0.489834 | 0.000851989 | 19.0648 | 06020014 | 0.00269887 | 0.487987 | 19.0840 |
| 2 | 06020012 | 0.488574 | 0.00211200 | 19.0129 | 06020015 | -0.00116776 | 0.491854 | 19.0761 |
| 3 | 06020016 | 0.490351 | 0.000335008 | 18.9827 | 06020011 | 0.00000 | 0.490686 | 18.9897 |