| Red | Green | Blue | |
| z | 17.64 | ||
| znorm | Inf | ||
| sky | -Inf | -Inf | -Inf |
| S/N | 19.4 | 33.0 | 34.4 |
| S/N(c) | 0.0 | 0.0 | 0.0 |
| SN(E/C) |


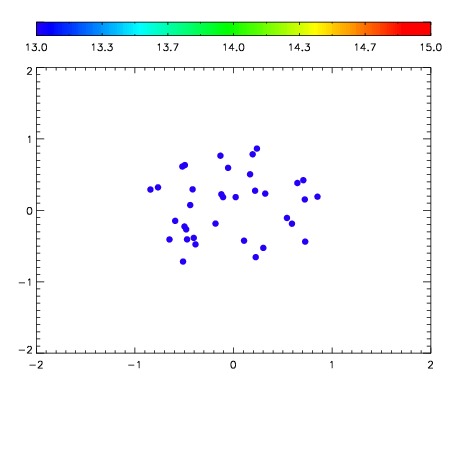

| Frame | Nreads | Zeropoints | Mag plots | Spatial mag deviation | Spatial sky 16325A emission deviations (filled: sky, open: star) | Spatial sky continuum emission | Spatial sky telluric CO2 absorption deviations (filled: H < 10) | |||||||||||||||||||||||
| 0 | 0 |
|
|
|
|
|
|
| IPAIR | NAME | SHIFT | NEWSHIFT | S/N | NAME | SHIFT | NEWSHIFT | S/N |
| 0 | 06090016 | 0.479034 | 0.00000 | 18.5938 | 06090014 | -0.000630035 | 0.479664 | 18.4834 |
| 1 | 06090015 | 0.478818 | 0.000216007 | 18.7159 | 06090010 | 0.00000 | 0.479034 | 18.6194 |
| 2 | 06090011 | 0.478186 | 0.000847995 | 18.7025 | 06090013 | 0.000245966 | 0.478788 | 18.4902 |
| 3 | 06090012 | 0.477799 | 0.00123501 | 18.5819 | 06090017 | -0.00358519 | 0.482619 | 18.4325 |