| Red | Green | Blue | |
| z | 17.64 | ||
| znorm | Inf | ||
| sky | -Inf | -Inf | -Inf |
| S/N | 32.4 | 46.9 | 50.6 |
| S/N(c) | 0.0 | 0.0 | 0.0 |
| SN(E/C) |

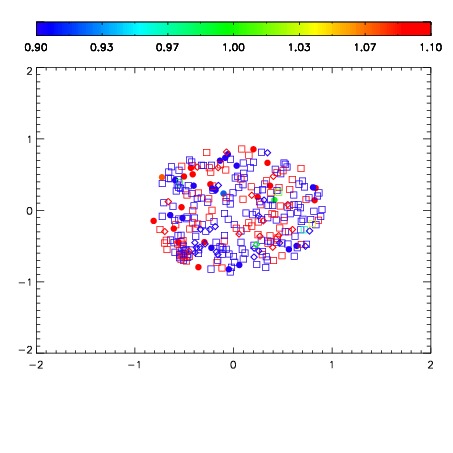


| Frame | Nreads | Zeropoints | Mag plots | Spatial mag deviation | Spatial sky 16325A emission deviations (filled: sky, open: star) | Spatial sky continuum emission | Spatial sky telluric CO2 absorption deviations (filled: H < 10) | |||||||||||||||||||||||
| 0 | 0 |
|
|
|
|
|
|
| IPAIR | NAME | SHIFT | NEWSHIFT | S/N | NAME | SHIFT | NEWSHIFT | S/N |
| 0 | 08440064 | 0.486096 | 0.00000 | 18.9355 | 08440065 | -0.00104311 | 0.487139 | 18.9899 |
| 1 | 08440060 | 0.485441 | 0.000654995 | 18.9103 | 08440062 | -0.000216387 | 0.486312 | 18.9202 |
| 2 | 08440063 | 0.484956 | 0.00114000 | 18.9012 | 08440058 | 0.00000 | 0.486096 | 18.9023 |
| 3 | 08440059 | 0.484723 | 0.00137299 | 18.8948 | 08440061 | 0.000247493 | 0.485849 | 18.8861 |