| Red | Green | Blue | |
| z | 17.63 | ||
| znorm | Inf | ||
| sky | -NaN | -NaN | -NaN |
| S/N | 19.6 | 28.5 | 29.0 |
| S/N(c) | 0.0 | 0.0 | 0.0 |
| SN(E/C) |
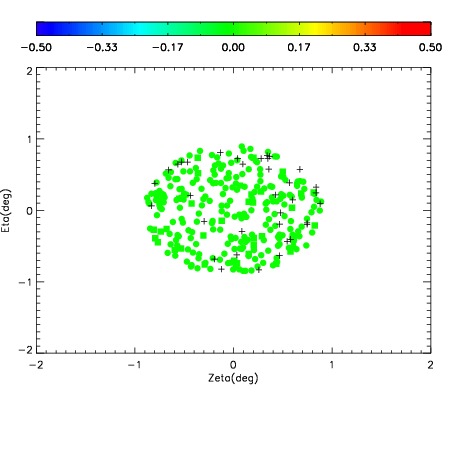
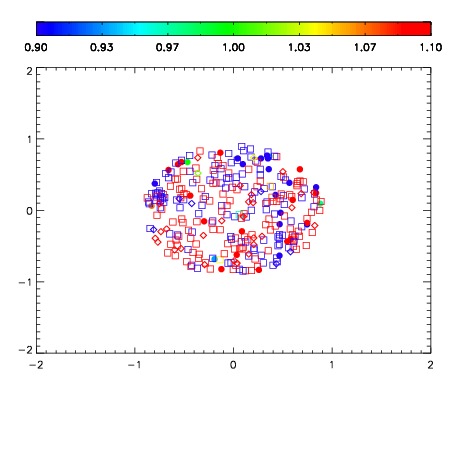


| Frame | Nreads | Zeropoints | Mag plots | Spatial mag deviation | Spatial sky 16325A emission deviations (filled: sky, open: star) | Spatial sky continuum emission | Spatial sky telluric CO2 absorption deviations (filled: H < 10) | |||||||||||||||||||||||
| 0 | 0 |
|
|
|
|
|
|
| IPAIR | NAME | SHIFT | NEWSHIFT | S/N | NAME | SHIFT | NEWSHIFT | S/N |
| 0 | 09090017 | 0.481493 | 0.00000 | 17.7861 | 09090011 | 0.00000 | 0.481493 | 18.4627 |
| 1 | 09090013 | 0.476361 | 0.00513199 | 18.6071 | 09090018 | 0.000147486 | 0.481346 | 18.7250 |
| 2 | 09090012 | 0.477910 | 0.00358298 | 18.2911 | 09090014 | -0.00117660 | 0.482670 | 18.5021 |