| Red | Green | Blue | |
| z | 17.63 | ||
| znorm | Inf | ||
| sky | -NaN | -NaN | -NaN |
| S/N | 35.6 | 49.7 | 52.2 |
| S/N(c) | 0.0 | 0.0 | 0.0 |
| SN(E/C) |
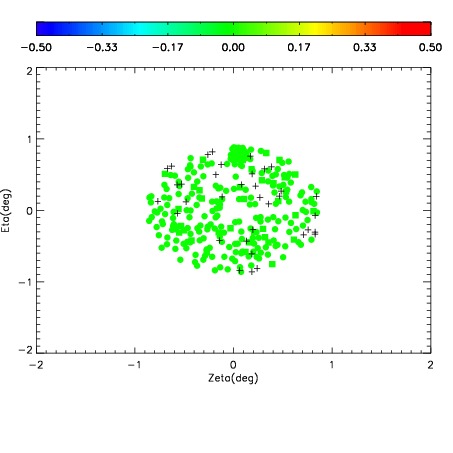
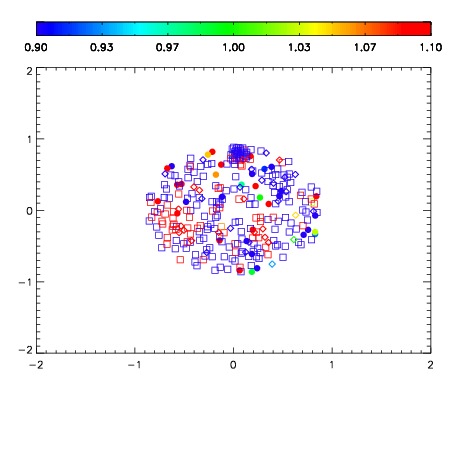
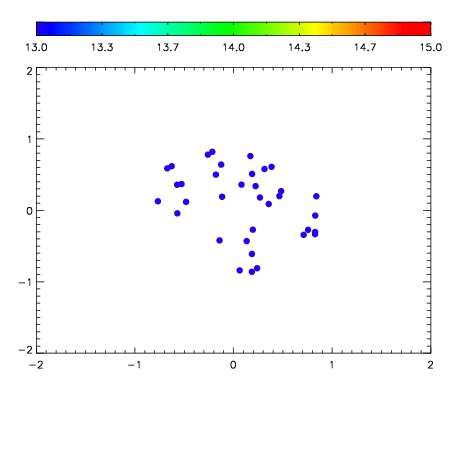

| Frame | Nreads | Zeropoints | Mag plots | Spatial mag deviation | Spatial sky 16325A emission deviations (filled: sky, open: star) | Spatial sky continuum emission | Spatial sky telluric CO2 absorption deviations (filled: H < 10) | |||||||||||||||||||||||
| 0 | 0 |
|
|
|
|
|
|
| IPAIR | NAME | SHIFT | NEWSHIFT | S/N | NAME | SHIFT | NEWSHIFT | S/N |
| 0 | 05230053 | 0.485943 | 0.00000 | 19.1549 | 05230050 | -0.00616942 | 0.492112 | 19.1755 |
| 1 | 05230052 | 0.485716 | 0.000227004 | 19.1617 | 05230051 | -0.00761236 | 0.493555 | 19.1879 |
| 2 | 05230049 | 0.485190 | 0.000752985 | 19.1502 | 05230054 | -0.00843461 | 0.494378 | 19.1291 |
| 3 | 05230048 | 0.485017 | 0.000925988 | 19.1221 | 05230047 | 0.00000 | 0.485943 | 19.1126 |