| Red | Green | Blue | |
| z | 17.64 | ||
| znorm | Inf | ||
| sky | -Inf | -NaN | -Inf |
| S/N | 30.7 | 44.6 | 47.3 |
| S/N(c) | 0.0 | 0.0 | 0.0 |
| SN(E/C) |

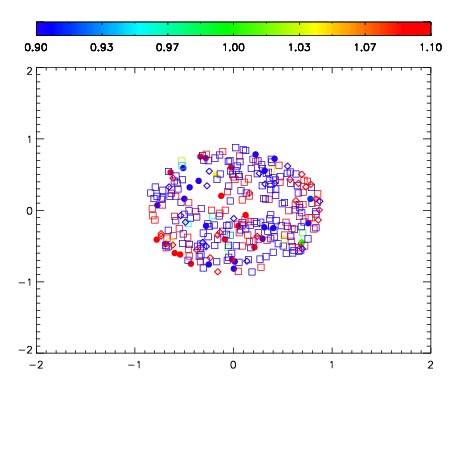


| Frame | Nreads | Zeropoints | Mag plots | Spatial mag deviation | Spatial sky 16325A emission deviations (filled: sky, open: star) | Spatial sky continuum emission | Spatial sky telluric CO2 absorption deviations (filled: H < 10) | |||||||||||||||||||||||
| 0 | 0 |
|
|
|
|
|
|
| IPAIR | NAME | SHIFT | NEWSHIFT | S/N | NAME | SHIFT | NEWSHIFT | S/N |
| 0 | 05220046 | 0.498877 | 0.00000 | 18.8939 | 05220043 | 0.00509952 | 0.493777 | 18.8487 |
| 1 | 05220045 | 0.497107 | 0.00176999 | 18.9364 | 05220044 | 0.00649946 | 0.492378 | 18.9318 |
| 2 | 05220042 | 0.495735 | 0.00314200 | 18.9250 | 05220040 | 0.00000 | 0.498877 | 18.8977 |
| 3 | 05220041 | 0.492500 | 0.00637698 | 18.9016 | 05220047 | 0.0105082 | 0.488369 | 18.8760 |