| Red | Green | Blue | |
| z | 17.64 | ||
| znorm | Inf | ||
| sky | -Inf | -Inf | -Inf |
| S/N | 35.9 | 50.5 | 51.7 |
| S/N(c) | 0.0 | 0.0 | 0.0 |
| SN(E/C) |
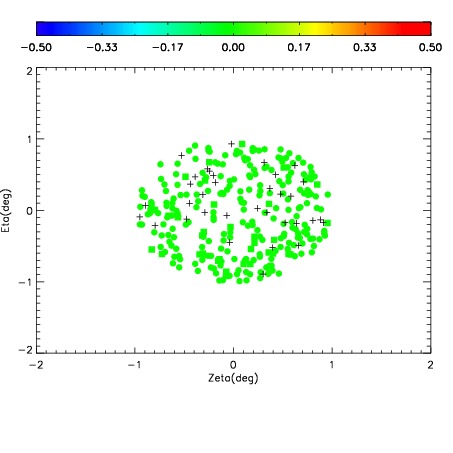
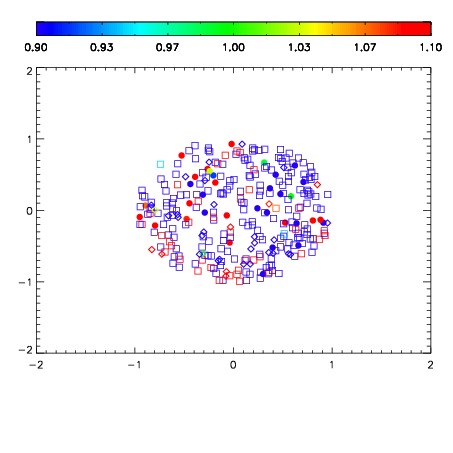
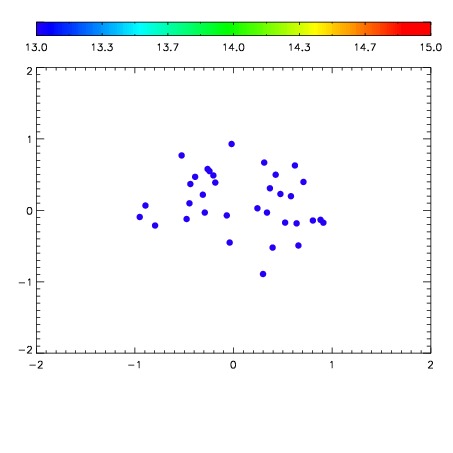

| Frame | Nreads | Zeropoints | Mag plots | Spatial mag deviation | Spatial sky 16325A emission deviations (filled: sky, open: star) | Spatial sky continuum emission | Spatial sky telluric CO2 absorption deviations (filled: H < 10) | |||||||||||||||||||||||
| 0 | 0 |
|
|
|
|
|
|
| IPAIR | NAME | SHIFT | NEWSHIFT | S/N | NAME | SHIFT | NEWSHIFT | S/N |
| 0 | 12520064 | 0.492820 | 0.00000 | 18.8880 | 12520063 | -0.00250533 | 0.495325 | 18.9188 |
| 1 | 12520065 | 0.491676 | 0.00114399 | 19.1309 | 12520066 | -0.000762621 | 0.493583 | 19.1344 |
| 2 | 12520061 | 0.489939 | 0.00288099 | 19.0400 | 12520062 | -0.00339722 | 0.496217 | 19.0621 |
| 3 | 12520060 | 0.489280 | 0.00354001 | 18.9478 | 12520059 | 0.00000 | 0.492820 | 18.9338 |