| Red | Green | Blue | |
| z | 17.64 | ||
| znorm | Inf | ||
| sky | -NaN | -NaN | -Inf |
| S/N | 34.5 | 48.5 | 50.7 |
| S/N(c) | 0.0 | 0.0 | 0.0 |
| SN(E/C) |
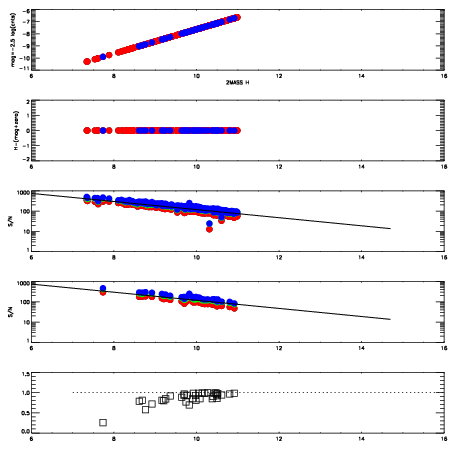
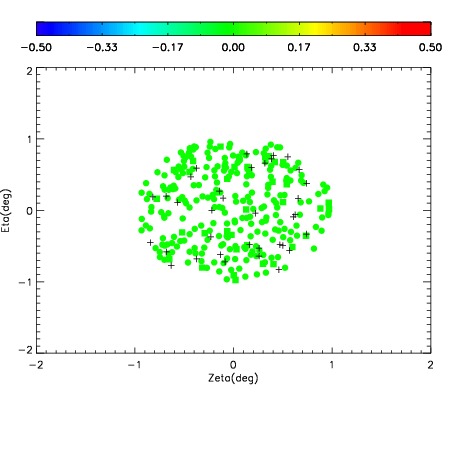
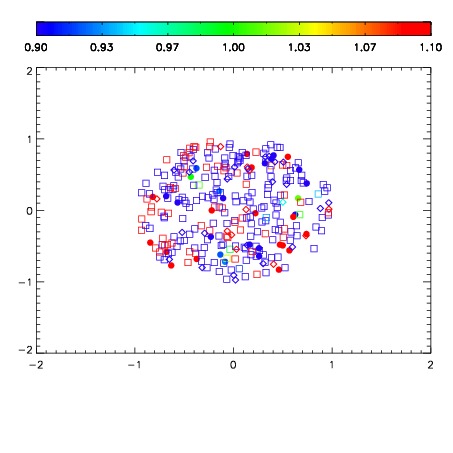


| Frame | Nreads | Zeropoints | Mag plots | Spatial mag deviation | Spatial sky 16325A emission deviations (filled: sky, open: star) | Spatial sky continuum emission | Spatial sky telluric CO2 absorption deviations (filled: H < 10) | |||||||||||||||||||||||
| 0 | 0 |
|
|
|
|
|
|
| IPAIR | NAME | SHIFT | NEWSHIFT | S/N | NAME | SHIFT | NEWSHIFT | S/N |
| 0 | 12500038 | 0.489162 | 0.00000 | 18.5261 | 12500037 | 0.00000 | 0.489162 | 18.7050 |
| 1 | 12500042 | 0.487143 | 0.00201899 | 19.1184 | 12500044 | -0.00457578 | 0.493738 | 19.0861 |
| 2 | 12500043 | 0.487319 | 0.00184301 | 19.1110 | 12500041 | -0.00354896 | 0.492711 | 19.0814 |
| 3 | 12500039 | 0.487583 | 0.00157899 | 19.0876 | 12500040 | -0.00298014 | 0.492142 | 19.0686 |