| Red | Green | Blue | |
| z | 17.64 | ||
| znorm | Inf | ||
| sky | -Inf | -NaN | -NaN |
| S/N | 29.5 | 47.3 | 49.2 |
| S/N(c) | 0.0 | 0.0 | 0.0 |
| SN(E/C) |

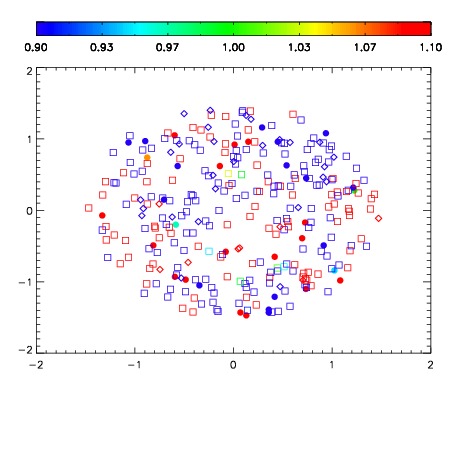


| Frame | Nreads | Zeropoints | Mag plots | Spatial mag deviation | Spatial sky 16325A emission deviations (filled: sky, open: star) | Spatial sky continuum emission | Spatial sky telluric CO2 absorption deviations (filled: H < 10) | |||||||||||||||||||||||
| 0 | 0 |
|
|
|
|
|
|
| IPAIR | NAME | SHIFT | NEWSHIFT | S/N | NAME | SHIFT | NEWSHIFT | S/N |
| 0 | 05200059 | 0.493820 | 0.00000 | 19.0928 | 05200062 | 0.00122590 | 0.492594 | 19.0698 |
| 1 | 05200064 | 0.491881 | 0.00193900 | 19.1211 | 05200065 | 3.49668e-05 | 0.493785 | 19.1005 |
| 2 | 05200060 | 0.493309 | 0.000511020 | 19.0936 | 05200061 | 0.00214526 | 0.491675 | 19.0847 |
| 3 | 05200063 | 0.492074 | 0.00174600 | 19.0903 | 05200058 | 0.00000 | 0.493820 | 19.0597 |