| Red | Green | Blue | |
| z | 17.64 | ||
| znorm | Inf | ||
| sky | -NaN | -NaN | -Inf |
| S/N | 27.3 | 44.3 | 46.7 |
| S/N(c) | 0.0 | 0.0 | 0.0 |
| SN(E/C) |
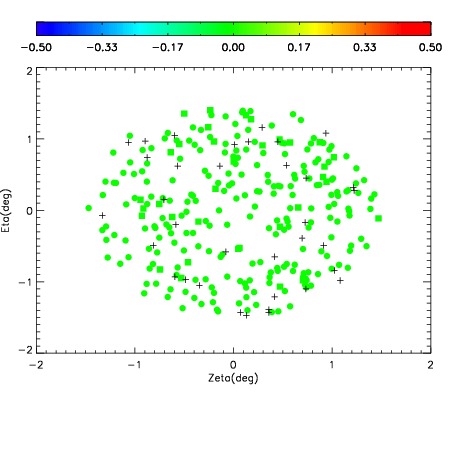
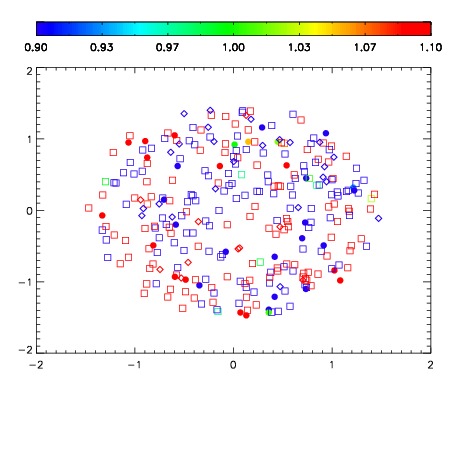
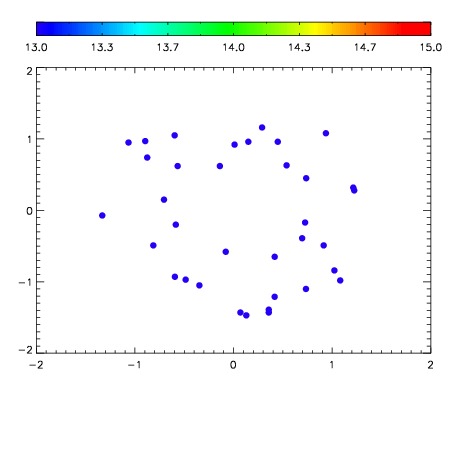

| Frame | Nreads | Zeropoints | Mag plots | Spatial mag deviation | Spatial sky 16325A emission deviations (filled: sky, open: star) | Spatial sky continuum emission | Spatial sky telluric CO2 absorption deviations (filled: H < 10) | |||||||||||||||||||||||
| 0 | 0 |
|
|
|
|
|
|
| IPAIR | NAME | SHIFT | NEWSHIFT | S/N | NAME | SHIFT | NEWSHIFT | S/N |
| 0 | 06100016 | 0.487154 | 0.00000 | 18.9271 | 06100017 | 0.00310953 | 0.484044 | 18.9108 |
| 1 | 06100015 | 0.486554 | 0.000600010 | 19.0627 | 06100014 | 0.00377362 | 0.483380 | 19.0391 |
| 2 | 06100012 | 0.485589 | 0.00156501 | 19.0274 | 06100013 | 0.00410038 | 0.483054 | 19.0147 |
| 3 | 06100011 | 0.484677 | 0.00247702 | 18.9984 | 06100010 | 0.00000 | 0.487154 | 18.9712 |