| Red | Green | Blue | |
| z | 17.64 | ||
| znorm | Inf | ||
| sky | -Inf | -Inf | -NaN |
| S/N | 24.6 | 40.6 | 42.0 |
| S/N(c) | 0.0 | 0.0 | 0.0 |
| SN(E/C) |
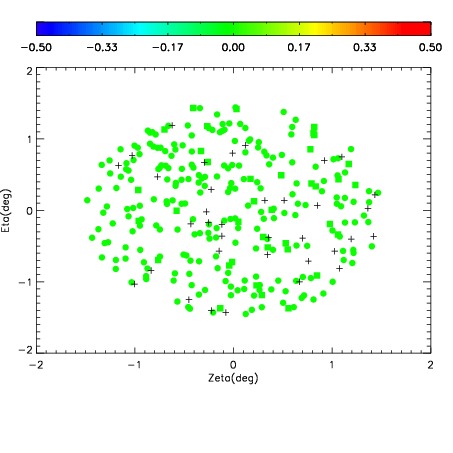
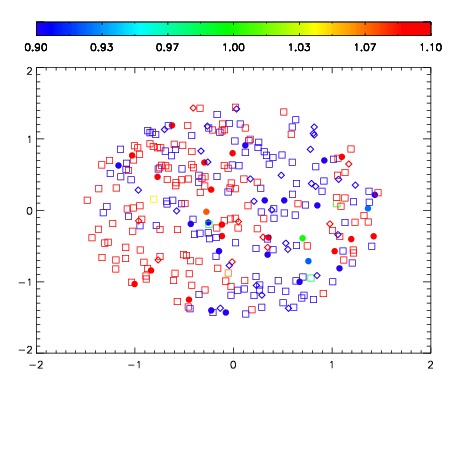
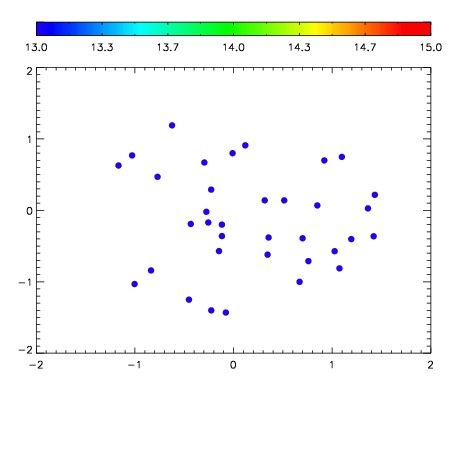

| Frame | Nreads | Zeropoints | Mag plots | Spatial mag deviation | Spatial sky 16325A emission deviations (filled: sky, open: star) | Spatial sky continuum emission | Spatial sky telluric CO2 absorption deviations (filled: H < 10) | |||||||||||||||||||||||
| 0 | 0 |
|
|
|
|
|
|
| IPAIR | NAME | SHIFT | NEWSHIFT | S/N | NAME | SHIFT | NEWSHIFT | S/N |
| 0 | 04880061 | 0.496652 | 0.00000 | 18.7878 | 04880059 | 0.00000 | 0.496652 | 18.7354 |
| 1 | 04880060 | 0.493099 | 0.00355300 | 18.8796 | 04880063 | 0.000443212 | 0.496209 | 18.8323 |
| 2 | 04880065 | 0.493319 | 0.00333300 | 18.8667 | 04880062 | -0.000598656 | 0.497251 | 18.8135 |
| 3 | 04880064 | 0.493279 | 0.00337300 | 18.8336 | 04880066 | 0.00130915 | 0.495343 | 18.8128 |