| Red | Green | Blue | |
| z | 17.64 | ||
| znorm | Inf | ||
| sky | -NaN | -NaN | -Inf |
| S/N | 27.5 | 45.4 | 48.8 |
| S/N(c) | 0.0 | 0.0 | 0.0 |
| SN(E/C) |

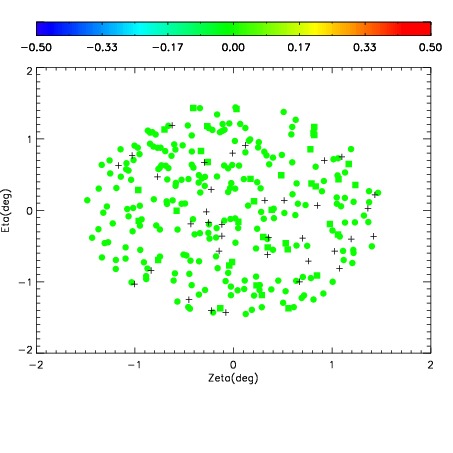
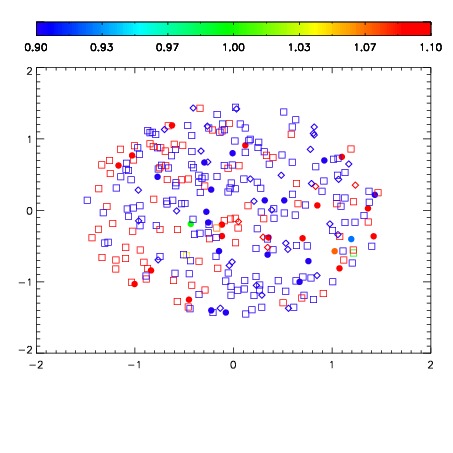


| Frame | Nreads | Zeropoints | Mag plots | Spatial mag deviation | Spatial sky 16325A emission deviations (filled: sky, open: star) | Spatial sky continuum emission | Spatial sky telluric CO2 absorption deviations (filled: H < 10) | |||||||||||||||||||||||
| 0 | 0 |
|
|
|
|
|
|
| IPAIR | NAME | SHIFT | NEWSHIFT | S/N | NAME | SHIFT | NEWSHIFT | S/N |
| 0 | 09080049 | 0.478705 | 0.00000 | 18.9787 | 09080048 | 0.00000 | 0.478705 | 18.9811 |
| 1 | 09080054 | 0.477025 | 0.00167999 | 19.0570 | 09080055 | 0.000109671 | 0.478595 | 19.0159 |
| 2 | 09080053 | 0.476301 | 0.00240397 | 19.0414 | 09080052 | 0.00110614 | 0.477599 | 19.0066 |
| 3 | 09080050 | 0.478059 | 0.000645995 | 18.9841 | 09080051 | 0.00130094 | 0.477404 | 18.9894 |