| Red | Green | Blue | |
| z | 17.64 | ||
| znorm | Inf | ||
| sky | -Inf | -Inf | -Inf |
| S/N | 24.5 | 40.8 | 43.7 |
| S/N(c) | 0.0 | 0.0 | 0.0 |
| SN(E/C) |
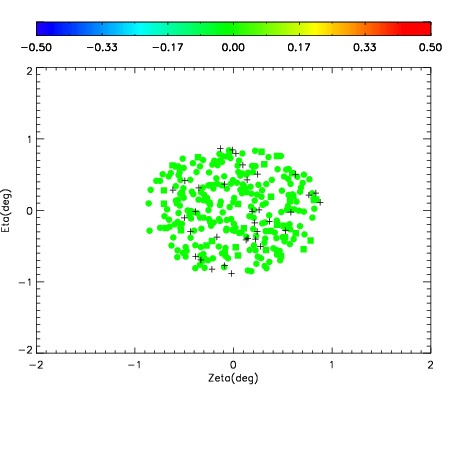
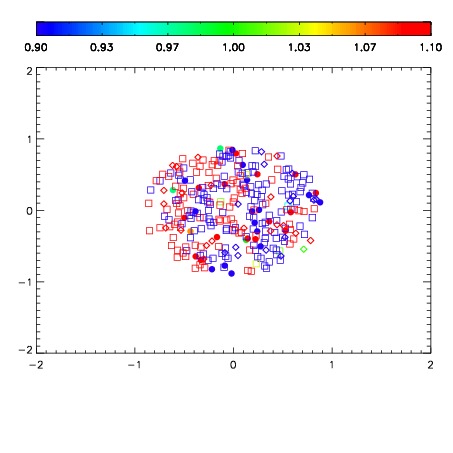


| Frame | Nreads | Zeropoints | Mag plots | Spatial mag deviation | Spatial sky 16325A emission deviations (filled: sky, open: star) | Spatial sky continuum emission | Spatial sky telluric CO2 absorption deviations (filled: H < 10) | |||||||||||||||||||||||
| 0 | 0 |
|
|
|
|
|
|
| IPAIR | NAME | SHIFT | NEWSHIFT | S/N | NAME | SHIFT | NEWSHIFT | S/N |
| 0 | 12500057 | 0.490895 | 0.00000 | 18.4856 | 12500056 | -0.00321572 | 0.494111 | 18.6741 |
| 1 | 12500053 | 0.490104 | 0.000791013 | 18.9135 | 12500052 | 0.00000 | 0.490895 | 19.0564 |
| 2 | 12500054 | 0.490699 | 0.000196010 | 18.9000 | 12500055 | -0.00197073 | 0.492866 | 18.7250 |
| 3 | 12500058 | 0.490509 | 0.000386000 | 18.2633 | 12500059 | -0.00310986 | 0.494005 | 17.9030 |