| Red | Green | Blue | |
| z | 17.64 | ||
| znorm | Inf | ||
| sky | -Inf | -Inf | -NaN |
| S/N | 28.4 | 47.7 | 46.8 |
| S/N(c) | 0.0 | 0.0 | 0.0 |
| SN(E/C) |

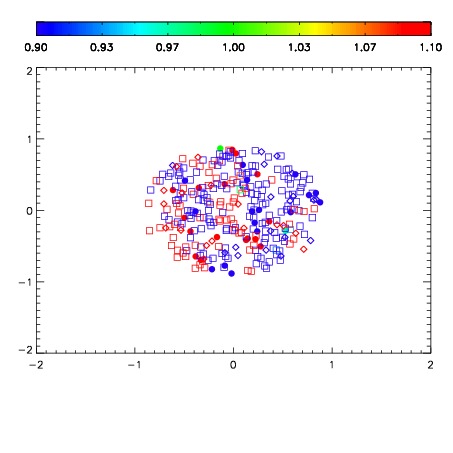


| Frame | Nreads | Zeropoints | Mag plots | Spatial mag deviation | Spatial sky 16325A emission deviations (filled: sky, open: star) | Spatial sky continuum emission | Spatial sky telluric CO2 absorption deviations (filled: H < 10) | |||||||||||||||||||||||
| 0 | 0 |
|
|
|
|
|
|
| IPAIR | NAME | SHIFT | NEWSHIFT | S/N | NAME | SHIFT | NEWSHIFT | S/N |
| 0 | 12510041 | 0.491632 | 0.00000 | 18.8574 | 12510042 | 0.00157050 | 0.490062 | 18.8387 |
| 1 | 12510037 | 0.488506 | 0.00312603 | 18.9638 | 12510039 | 0.000730013 | 0.490902 | 18.9782 |
| 2 | 12510040 | 0.491320 | 0.000312001 | 18.9526 | 12510038 | 0.000428625 | 0.491203 | 18.9626 |
| 3 | 12510036 | 0.487558 | 0.00407401 | 18.8059 | 12510035 | 0.00000 | 0.491632 | 18.8137 |
| 4 | 12510044 | 0.490351 | 0.00128102 | 18.5823 | 12510043 | 0.00156104 | 0.490071 | 18.7354 |