| Red | Green | Blue | |
| z | 17.64 | ||
| znorm | Inf | ||
| sky | -Inf | -Inf | -Inf |
| S/N | 11.8 | 20.7 | 22.7 |
| S/N(c) | 0.0 | 0.0 | 0.0 |
| SN(E/C) |


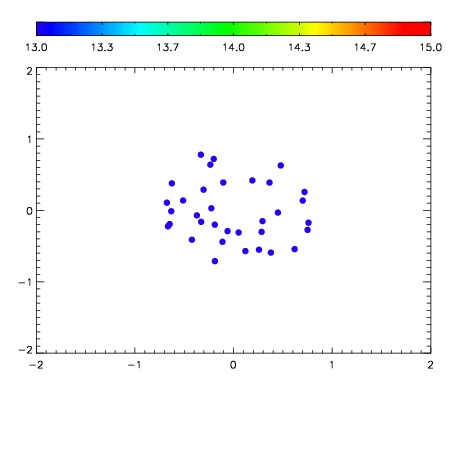

| Frame | Nreads | Zeropoints | Mag plots | Spatial mag deviation | Spatial sky 16325A emission deviations (filled: sky, open: star) | Spatial sky continuum emission | Spatial sky telluric CO2 absorption deviations (filled: H < 10) | |||||||||||||||||||||||
| 0 | 0 |
|
|
|
|
|
|
| IPAIR | NAME | SHIFT | NEWSHIFT | S/N | NAME | SHIFT | NEWSHIFT | S/N |
| 0 | 12490048 | 0.494269 | 0.00000 | 17.9662 | 12490045 | 0.000596403 | 0.493673 | 17.6849 |
| 1 | 12490044 | 0.492298 | 0.00197101 | 18.1530 | 12490042 | 0.00000 | 0.494269 | 18.3068 |
| 2 | 12490043 | 0.492144 | 0.00212502 | 18.0191 | 12490049 | -0.000205857 | 0.494475 | 17.7334 |
| 3 | 12490047 | 0.494261 | 8.01682e-06 | 17.6206 | 12490046 | 0.000150765 | 0.494118 | 17.2281 |