| Red | Green | Blue | |
| z | 17.64 | ||
| znorm | Inf | ||
| sky | -Inf | -Inf | -Inf |
| S/N | 21.7 | 37.5 | 37.1 |
| S/N(c) | 0.0 | 0.0 | 0.0 |
| SN(E/C) |
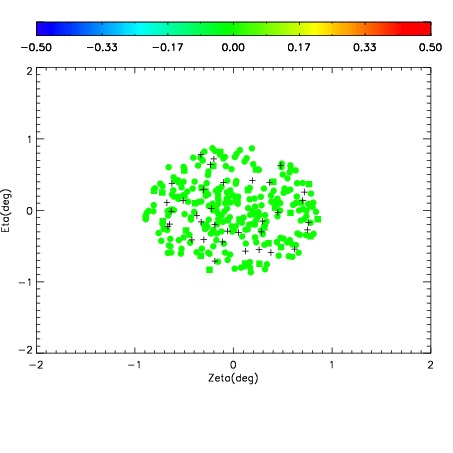

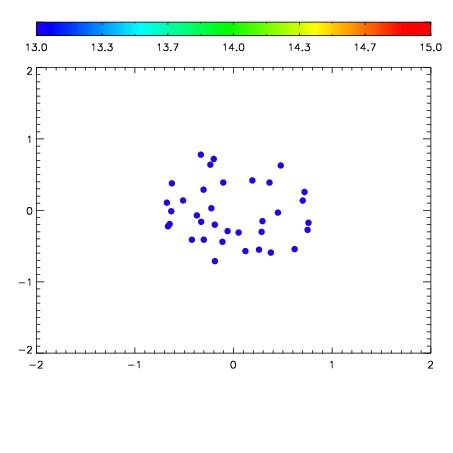

| Frame | Nreads | Zeropoints | Mag plots | Spatial mag deviation | Spatial sky 16325A emission deviations (filled: sky, open: star) | Spatial sky continuum emission | Spatial sky telluric CO2 absorption deviations (filled: H < 10) | |||||||||||||||||||||||
| 0 | 0 |
|
|
|
|
|
|
| IPAIR | NAME | SHIFT | NEWSHIFT | S/N | NAME | SHIFT | NEWSHIFT | S/N |
| 0 | 12550064 | 0.494517 | 0.00000 | 18.7217 | 12550066 | 0.000270845 | 0.494246 | 18.6793 |
| 1 | 12550060 | 0.489459 | 0.00505799 | 19.0061 | 12550059 | 0.00000 | 0.494517 | 18.9229 |
| 2 | 12550061 | 0.490423 | 0.00409400 | 18.9828 | 12550062 | -0.00122660 | 0.495744 | 18.8667 |
| 3 | 12550065 | 0.493620 | 0.000896990 | 18.8307 | 12550063 | -0.000616229 | 0.495133 | 18.8110 |