| Red | Green | Blue | |
| z | 17.64 | ||
| znorm | Inf | ||
| sky | -Inf | -Inf | -Inf |
| S/N | 28.3 | 47.4 | 49.3 |
| S/N(c) | 0.0 | 0.0 | 0.0 |
| SN(E/C) |


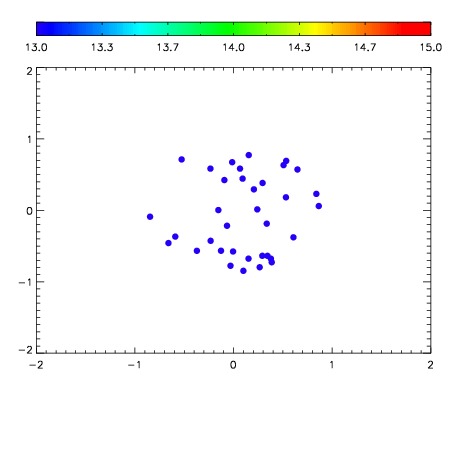

| Frame | Nreads | Zeropoints | Mag plots | Spatial mag deviation | Spatial sky 16325A emission deviations (filled: sky, open: star) | Spatial sky continuum emission | Spatial sky telluric CO2 absorption deviations (filled: H < 10) | |||||||||||||||||||||||
| 0 | 0 |
|
|
|
|
|
|
| IPAIR | NAME | SHIFT | NEWSHIFT | S/N | NAME | SHIFT | NEWSHIFT | S/N |
| 0 | 05240069 | 0.489134 | 0.00000 | 19.1554 | 05240063 | 0.00000 | 0.489134 | 19.1329 |
| 1 | 05240068 | 0.488949 | 0.000185013 | 19.2364 | 05240067 | 0.000652208 | 0.488482 | 19.2105 |
| 2 | 05240065 | 0.489093 | 4.10080e-05 | 19.1444 | 05240070 | 0.00376734 | 0.485367 | 19.1309 |
| 3 | 05240064 | 0.487361 | 0.00177300 | 19.0174 | 05240066 | 0.00363175 | 0.485502 | 19.1215 |