| Red | Green | Blue | |
| z | 17.64 | ||
| znorm | Inf | ||
| sky | -Inf | -Inf | -NaN |
| S/N | 23.8 | 41.0 | 42.0 |
| S/N(c) | 0.0 | 0.0 | 0.0 |
| SN(E/C) |
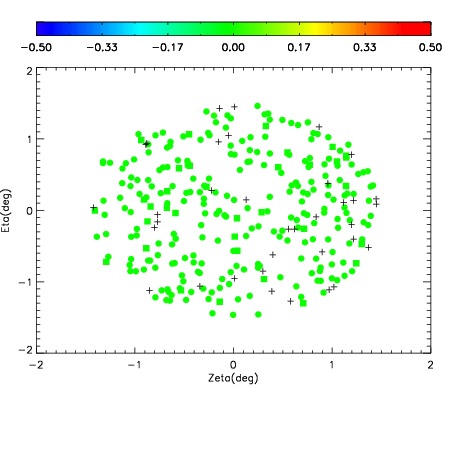
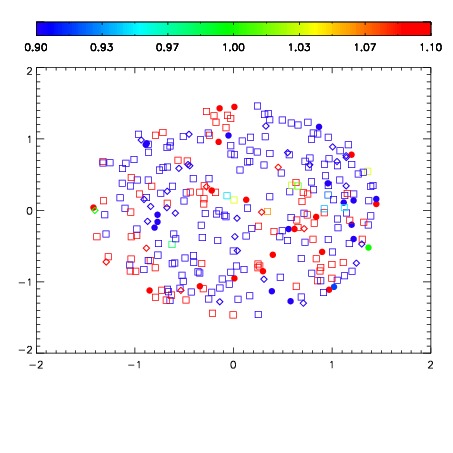
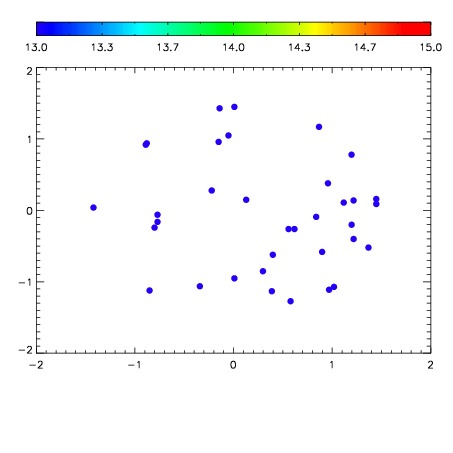

| Frame | Nreads | Zeropoints | Mag plots | Spatial mag deviation | Spatial sky 16325A emission deviations (filled: sky, open: star) | Spatial sky continuum emission | Spatial sky telluric CO2 absorption deviations (filled: H < 10) | |||||||||||||||||||||||
| 0 | 0 |
|
|
|
|
|
|
| IPAIR | NAME | SHIFT | NEWSHIFT | S/N | NAME | SHIFT | NEWSHIFT | S/N |
| 0 | 05480027 | 0.484486 | 0.00000 | 18.8876 | 05480028 | 0.00147248 | 0.483014 | 18.9019 |
| 1 | 05480030 | 0.480606 | 0.00388002 | 18.9555 | 05480032 | -1.08058e-05 | 0.484497 | 18.9607 |
| 2 | 05480031 | 0.483025 | 0.00146100 | 18.9336 | 05480029 | 0.000254419 | 0.484232 | 18.9084 |
| 3 | 05480026 | 0.481443 | 0.00304303 | 18.8698 | 05480025 | 0.00000 | 0.484486 | 18.8572 |