| Red | Green | Blue | |
| z | 17.64 | ||
| znorm | Inf | ||
| sky | -Inf | -Inf | -Inf |
| S/N | 26.0 | 44.1 | 47.0 |
| S/N(c) | 0.0 | 0.0 | 0.0 |
| SN(E/C) |
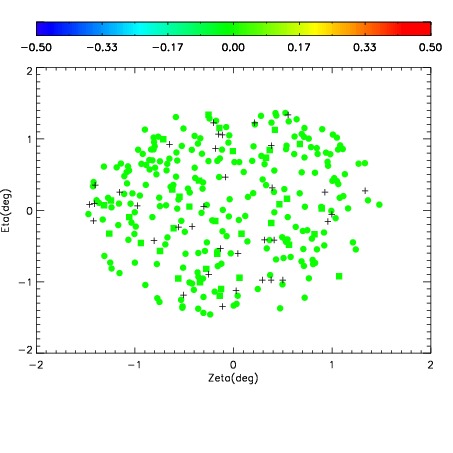
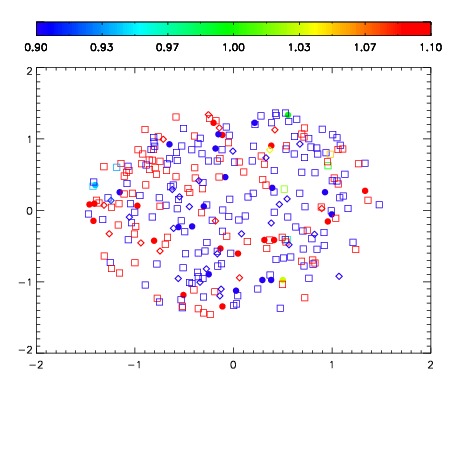
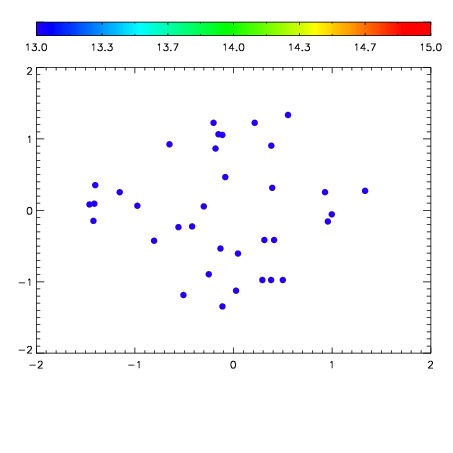

| Frame | Nreads | Zeropoints | Mag plots | Spatial mag deviation | Spatial sky 16325A emission deviations (filled: sky, open: star) | Spatial sky continuum emission | Spatial sky telluric CO2 absorption deviations (filled: H < 10) | |||||||||||||||||||||||
| 0 | 0 |
|
|
|
|
|
|
| IPAIR | NAME | SHIFT | NEWSHIFT | S/N | NAME | SHIFT | NEWSHIFT | S/N |
| 0 | 09990015 | 0.526219 | 0.00000 | 19.0721 | 09990017 | 8.94793e-05 | 0.526130 | 19.1135 |
| 1 | 09990014 | 0.525968 | 0.000250995 | 19.0213 | 09990016 | 0.000202947 | 0.526016 | 19.0877 |
| 2 | 09990018 | 0.524791 | 0.00142801 | 19.0205 | 09990020 | 0.00368132 | 0.522538 | 18.9833 |
| 3 | 09990019 | 0.524368 | 0.00185102 | 19.0152 | 09990013 | 0.00000 | 0.526219 | 18.9349 |