| Red | Green | Blue | |
| z | 17.64 | ||
| znorm | Inf | ||
| sky | -NaN | -NaN | -Inf |
| S/N | 22.5 | 38.2 | 39.7 |
| S/N(c) | 0.0 | 0.0 | 0.0 |
| SN(E/C) |
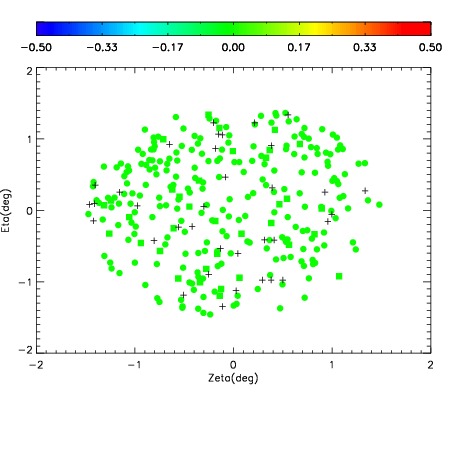


| Frame | Nreads | Zeropoints | Mag plots | Spatial mag deviation | Spatial sky 16325A emission deviations (filled: sky, open: star) | Spatial sky continuum emission | Spatial sky telluric CO2 absorption deviations (filled: H < 10) | |||||||||||||||||||||||
| 0 | 0 |
|
|
|
|
|
|
| IPAIR | NAME | SHIFT | NEWSHIFT | S/N | NAME | SHIFT | NEWSHIFT | S/N |
| 0 | 10030013 | 0.463734 | 0.00000 | 19.0381 | 10030014 | 0.000324945 | 0.463409 | 19.0554 |
| 1 | 10030016 | 0.463391 | 0.000342995 | 19.0725 | 10030015 | 0.000102273 | 0.463632 | 19.0924 |
| 2 | 10030012 | 0.463057 | 0.000676990 | 19.0273 | 10030011 | 0.00000 | 0.463734 | 18.9608 |