| Red | Green | Blue | |
| z | 17.64 | ||
| znorm | Inf | ||
| sky | -NaN | -NaN | -Inf |
| S/N | 20.2 | 34.5 | 35.7 |
| S/N(c) | 0.0 | 0.0 | 0.0 |
| SN(E/C) |


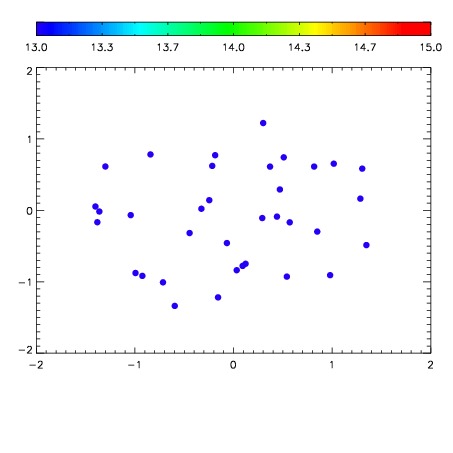

| Frame | Nreads | Zeropoints | Mag plots | Spatial mag deviation | Spatial sky 16325A emission deviations (filled: sky, open: star) | Spatial sky continuum emission | Spatial sky telluric CO2 absorption deviations (filled: H < 10) | |||||||||||||||||||||||
| 0 | 0 |
|
|
|
|
|
|
| IPAIR | NAME | SHIFT | NEWSHIFT | S/N | NAME | SHIFT | NEWSHIFT | S/N |
| 0 | 04870083 | 0.496183 | 0.00000 | 18.8772 | 04870084 | 0.000375806 | 0.495807 | 18.9667 |
| 1 | 04870086 | 0.495063 | 0.00112000 | 18.8473 | 04870085 | 0.000838656 | 0.495344 | 18.8374 |
| 2 | 04870082 | 0.496074 | 0.000109017 | 18.6818 | 04870081 | 0.00000 | 0.496183 | 18.6958 |