| Red | Green | Blue | |
| z | 17.63 | ||
| znorm | Inf | ||
| sky | -NaN | -NaN | -Inf |
| S/N | 27.3 | 45.4 | 47.7 |
| S/N(c) | 0.0 | 0.0 | 0.0 |
| SN(E/C) |
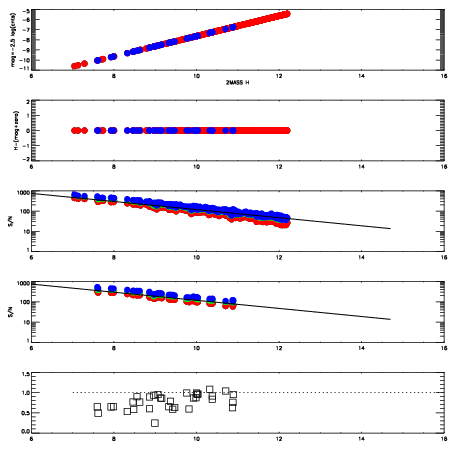


| Frame | Nreads | Zeropoints | Mag plots | Spatial mag deviation | Spatial sky 16325A emission deviations (filled: sky, open: star) | Spatial sky continuum emission | Spatial sky telluric CO2 absorption deviations (filled: H < 10) | |||||||||||||||||||||||
| 0 | 0 |
|
|
|
|
|
|
| IPAIR | NAME | SHIFT | NEWSHIFT | S/N | NAME | SHIFT | NEWSHIFT | S/N |
| 0 | 04910075 | 0.491329 | 0.00000 | 18.9988 | 04910069 | 0.00000 | 0.491329 | 19.0473 |
| 1 | 04910070 | 0.486772 | 0.00455701 | 19.0924 | 04910073 | -0.00276603 | 0.494095 | 19.0840 |
| 2 | 04910071 | 0.487727 | 0.00360203 | 19.0748 | 04910072 | -0.000495173 | 0.491824 | 19.0753 |
| 3 | 04910074 | 0.486113 | 0.00521600 | 19.0460 | 04910076 | -7.82270e-06 | 0.491337 | 19.0603 |