| Red | Green | Blue | |
| z | 17.63 | ||
| znorm | Inf | ||
| sky | -NaN | -NaN | -Inf |
| S/N | 24.4 | 40.6 | 41.9 |
| S/N(c) | 0.0 | 0.0 | 0.0 |
| SN(E/C) |
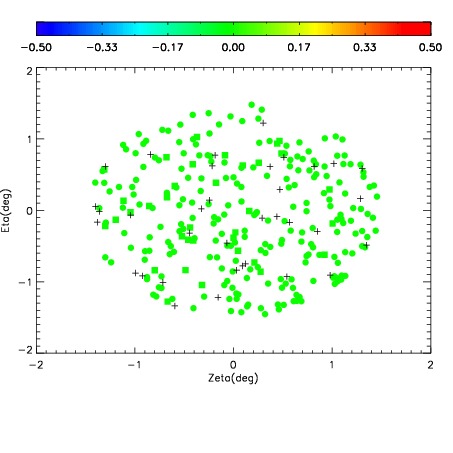


| Frame | Nreads | Zeropoints | Mag plots | Spatial mag deviation | Spatial sky 16325A emission deviations (filled: sky, open: star) | Spatial sky continuum emission | Spatial sky telluric CO2 absorption deviations (filled: H < 10) | |||||||||||||||||||||||
| 0 | 0 |
|
|
|
|
|
|
| IPAIR | NAME | SHIFT | NEWSHIFT | S/N | NAME | SHIFT | NEWSHIFT | S/N |
| 0 | 09040028 | 0.484240 | 0.00000 | 18.8429 | 09040026 | 0.00332358 | 0.480916 | 18.9201 |
| 1 | 09040023 | 0.479801 | 0.00443900 | 18.9838 | 09040029 | 0.00446106 | 0.479779 | 19.0077 |
| 2 | 09040027 | 0.483183 | 0.00105700 | 18.9744 | 09040025 | 0.00294652 | 0.481293 | 18.9759 |
| 3 | 09040024 | 0.479434 | 0.00480598 | 18.9703 | 09040022 | 0.00000 | 0.484240 | 18.9466 |