| Red | Green | Blue | |
| z | 17.64 | ||
| znorm | Inf | ||
| sky | -Inf | -NaN | -NaN |
| S/N | 22.9 | 38.5 | 40.3 |
| S/N(c) | 0.0 | 0.0 | 0.0 |
| SN(E/C) |
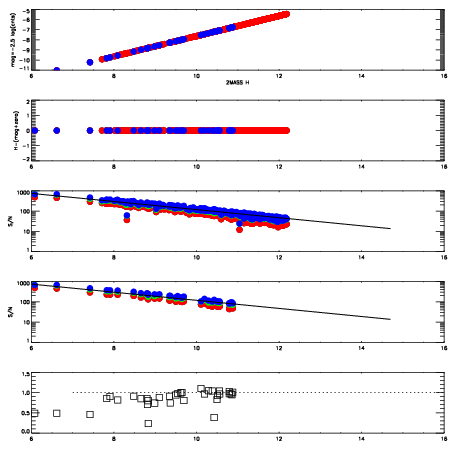
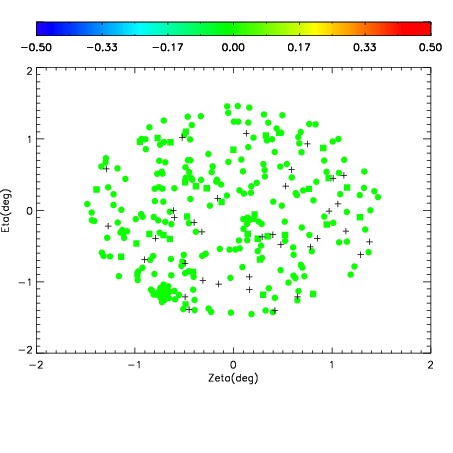
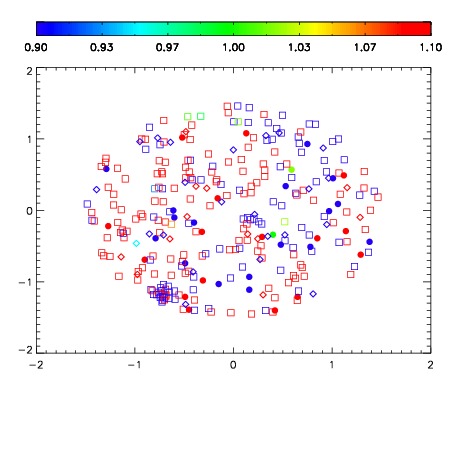
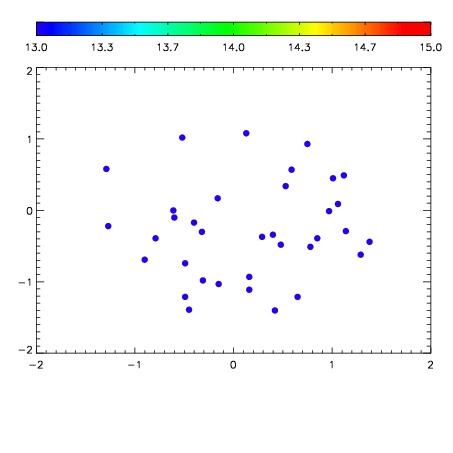

| Frame | Nreads | Zeropoints | Mag plots | Spatial mag deviation | Spatial sky 16325A emission deviations (filled: sky, open: star) | Spatial sky continuum emission | Spatial sky telluric CO2 absorption deviations (filled: H < 10) | |||||||||||||||||||||||
| 0 | 0 |
|
|
|
|
|
|
| IPAIR | NAME | SHIFT | NEWSHIFT | S/N | NAME | SHIFT | NEWSHIFT | S/N |
| 0 | 12110039 | 0.495096 | 0.00000 | 18.5004 | 12110033 | 0.00000 | 0.495096 | 18.6676 |
| 1 | 12110038 | 0.494611 | 0.000485003 | 18.7724 | 12110040 | -0.000956011 | 0.496052 | 18.9152 |
| 2 | 12110035 | 0.494467 | 0.000629008 | 18.7696 | 12110037 | -0.00159922 | 0.496695 | 18.8110 |
| 3 | 12110034 | 0.494522 | 0.000573993 | 18.6950 | 12110036 | -0.00140558 | 0.496502 | 18.7023 |