| Red | Green | Blue | |
| z | 17.64 | ||
| znorm | Inf | ||
| sky | -Inf | -Inf | -NaN |
| S/N | 26.1 | 43.2 | 44.5 |
| S/N(c) | 0.0 | 0.0 | 0.0 |
| SN(E/C) |
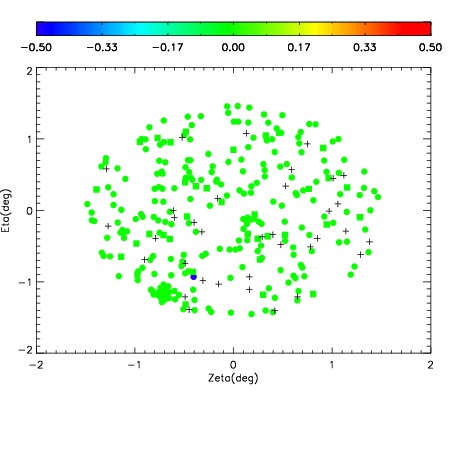
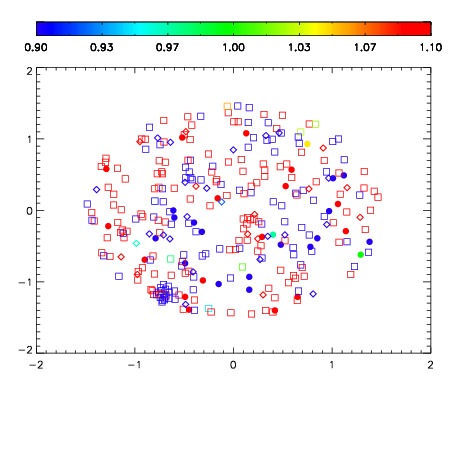
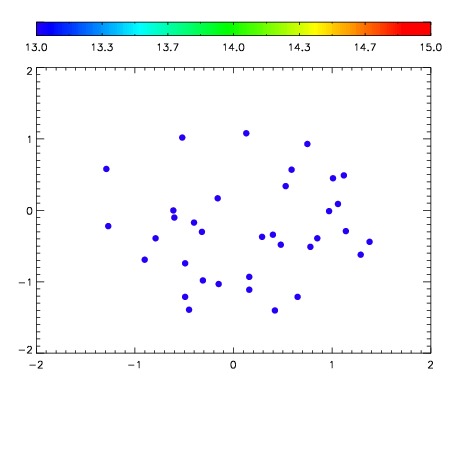

| Frame | Nreads | Zeropoints | Mag plots | Spatial mag deviation | Spatial sky 16325A emission deviations (filled: sky, open: star) | Spatial sky continuum emission | Spatial sky telluric CO2 absorption deviations (filled: H < 10) | |||||||||||||||||||||||
| 0 | 0 |
|
|
|
|
|
|
| IPAIR | NAME | SHIFT | NEWSHIFT | S/N | NAME | SHIFT | NEWSHIFT | S/N |
| 0 | 12400031 | 0.495954 | 0.00000 | 18.9457 | 12400030 | -0.00202445 | 0.497978 | 18.9615 |
| 1 | 12400032 | 0.495925 | 2.89977e-05 | 19.0060 | 12400033 | -0.00112154 | 0.497076 | 19.0238 |
| 2 | 12400028 | 0.494223 | 0.00173101 | 18.8052 | 12400029 | -0.00226975 | 0.498224 | 18.8674 |
| 3 | 12400027 | 0.494914 | 0.00104001 | 18.7494 | 12400026 | 0.00000 | 0.495954 | 18.8470 |