| Red | Green | Blue | |
| z | 17.63 | ||
| znorm | Inf | ||
| sky | -NaN | -NaN | -NaN |
| S/N | 20.5 | 36.6 | 37.8 |
| S/N(c) | 0.0 | 0.0 | 0.0 |
| SN(E/C) |
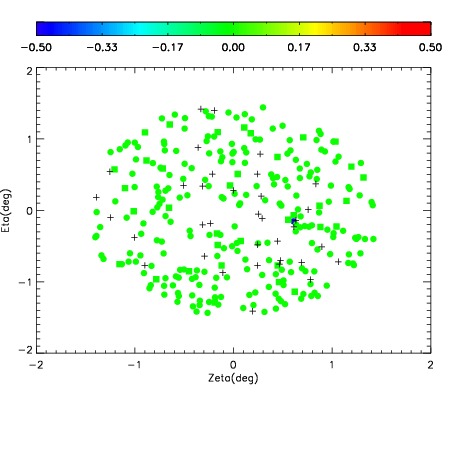
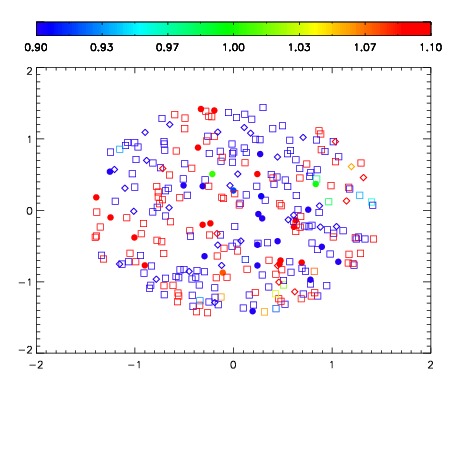


| Frame | Nreads | Zeropoints | Mag plots | Spatial mag deviation | Spatial sky 16325A emission deviations (filled: sky, open: star) | Spatial sky continuum emission | Spatial sky telluric CO2 absorption deviations (filled: H < 10) | |||||||||||||||||||||||
| 0 | 0 |
|
|
|
|
|
|
| IPAIR | NAME | SHIFT | NEWSHIFT | S/N | NAME | SHIFT | NEWSHIFT | S/N |
| 0 | 12070079 | 0.491606 | 0.00000 | 18.6169 | 12070084 | -0.0136767 | 0.505283 | 18.7080 |
| 1 | 12070082 | 0.490788 | 0.000817984 | 18.6133 | 12070081 | 0.00103489 | 0.490571 | 18.6645 |
| 2 | 12070083 | 0.491005 | 0.000600994 | 18.6108 | 12070080 | 0.000346520 | 0.491259 | 18.6209 |
| 3 | 12070078 | 0.490933 | 0.000672996 | 18.5530 | 12070077 | 0.00000 | 0.491606 | 18.5467 |