| Red | Green | Blue | |
| z | 17.63 | ||
| znorm | Inf | ||
| sky | -NaN | -NaN | -NaN |
| S/N | 18.1 | 32.8 | 33.3 |
| S/N(c) | 0.0 | 0.0 | 0.0 |
| SN(E/C) |
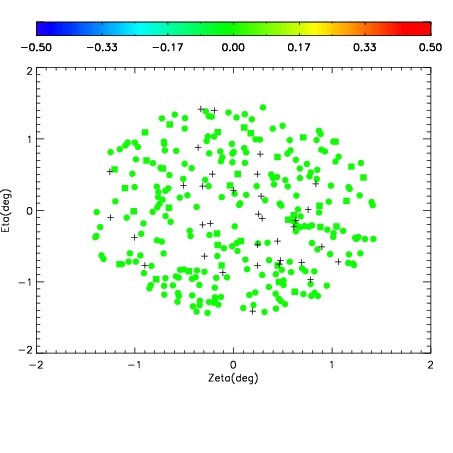
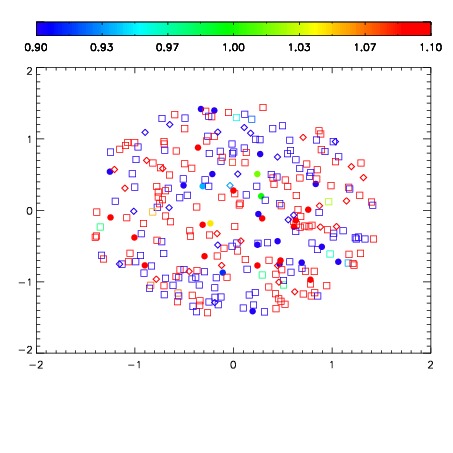
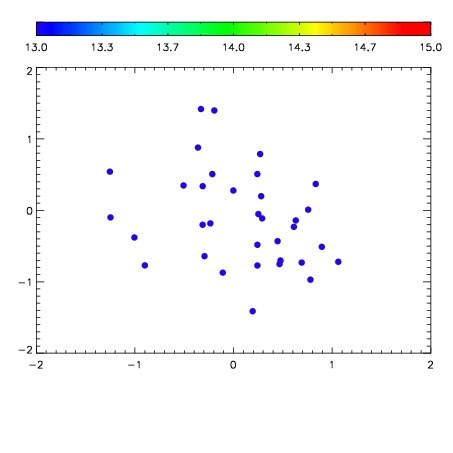

| Frame | Nreads | Zeropoints | Mag plots | Spatial mag deviation | Spatial sky 16325A emission deviations (filled: sky, open: star) | Spatial sky continuum emission | Spatial sky telluric CO2 absorption deviations (filled: H < 10) | |||||||||||||||||||||||
| 0 | 0 |
|
|
|
|
|
|
| IPAIR | NAME | SHIFT | NEWSHIFT | S/N | NAME | SHIFT | NEWSHIFT | S/N |
| 0 | 12110024 | 0.496261 | 0.00000 | 18.5598 | 12110029 | -0.00289823 | 0.499159 | 18.6208 |
| 1 | 12110027 | 0.495803 | 0.000458002 | 18.6260 | 12110025 | -0.00166558 | 0.497927 | 18.7627 |
| 2 | 12110028 | 0.495706 | 0.000555009 | 18.3874 | 12110026 | -0.00131574 | 0.497577 | 18.5517 |
| 3 | 12110023 | 0.496191 | 7.00057e-05 | 17.9762 | 12110022 | 0.00000 | 0.496261 | 17.2861 |