| Red | Green | Blue | |
| z | 17.63 | ||
| znorm | Inf | ||
| sky | -NaN | -NaN | -NaN |
| S/N | 24.4 | 41.1 | 43.8 |
| S/N(c) | 0.0 | 0.0 | 0.0 |
| SN(E/C) |


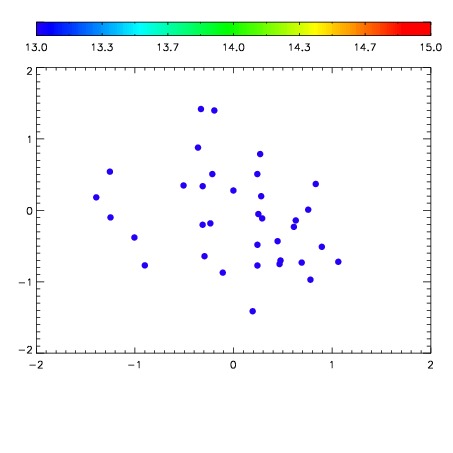

| Frame | Nreads | Zeropoints | Mag plots | Spatial mag deviation | Spatial sky 16325A emission deviations (filled: sky, open: star) | Spatial sky continuum emission | Spatial sky telluric CO2 absorption deviations (filled: H < 10) | |||||||||||||||||||||||
| 0 | 0 |
|
|
|
|
|
|
| IPAIR | NAME | SHIFT | NEWSHIFT | S/N | NAME | SHIFT | NEWSHIFT | S/N |
| 0 | 12440039 | 0.489876 | 0.00000 | 18.9167 | 12440033 | 0.00000 | 0.489876 | 18.9516 |
| 1 | 12440038 | 0.489081 | 0.000795007 | 18.9706 | 12440036 | -0.000885124 | 0.490761 | 19.0185 |
| 2 | 12440035 | 0.488164 | 0.00171199 | 18.9688 | 12440037 | -0.000736283 | 0.490612 | 18.9945 |
| 3 | 12440034 | 0.487393 | 0.00248301 | 18.8905 | 12440040 | 0.00235747 | 0.487519 | 18.9372 |