| Red | Green | Blue | |
| z | 17.64 | ||
| znorm | Inf | ||
| sky | -Inf | -Inf | -Inf |
| S/N | 25.0 | 43.5 | 45.4 |
| S/N(c) | 0.0 | 0.0 | 0.0 |
| SN(E/C) |

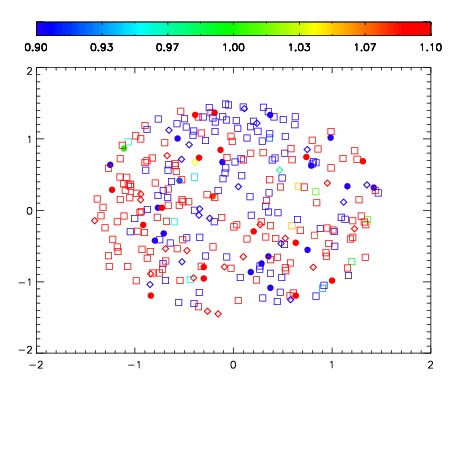
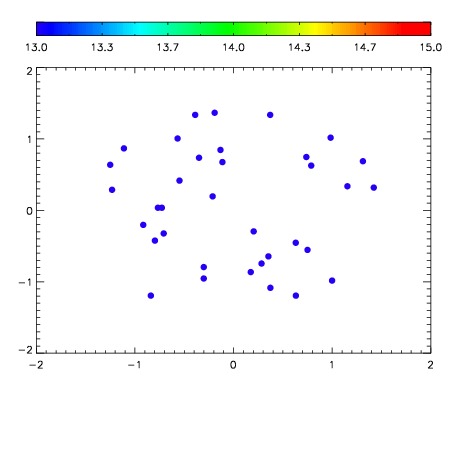

| Frame | Nreads | Zeropoints | Mag plots | Spatial mag deviation | Spatial sky 16325A emission deviations (filled: sky, open: star) | Spatial sky continuum emission | Spatial sky telluric CO2 absorption deviations (filled: H < 10) | |||||||||||||||||||||||
| 0 | 0 |
|
|
|
|
|
|
| IPAIR | NAME | SHIFT | NEWSHIFT | S/N | NAME | SHIFT | NEWSHIFT | S/N |
| 0 | 12430039 | 0.492544 | 0.00000 | 19.0218 | 12430037 | -0.000835002 | 0.493379 | 18.9813 |
| 1 | 12430034 | 0.491017 | 0.00152698 | 19.0751 | 12430036 | -0.000491009 | 0.493035 | 19.0793 |
| 2 | 12430035 | 0.492089 | 0.000454992 | 19.0724 | 12430033 | 0.00000 | 0.492544 | 18.9908 |
| 3 | 12430038 | 0.491906 | 0.000638008 | 18.9801 | 12430040 | -0.00171394 | 0.494258 | 18.8690 |