| Red | Green | Blue | |
| z | 17.64 | ||
| znorm | Inf | ||
| sky | -Inf | -Inf | -Inf |
| S/N | 24.4 | 41.4 | 44.4 |
| S/N(c) | 0.0 | 0.0 | 0.0 |
| SN(E/C) |
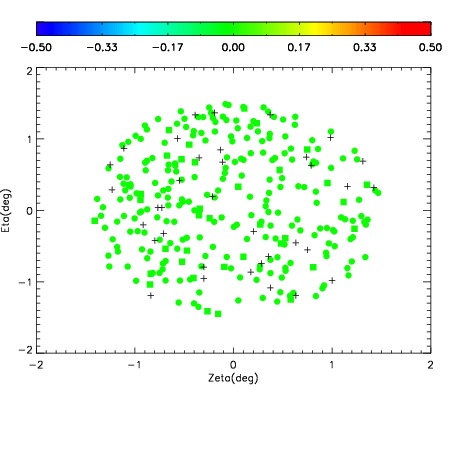
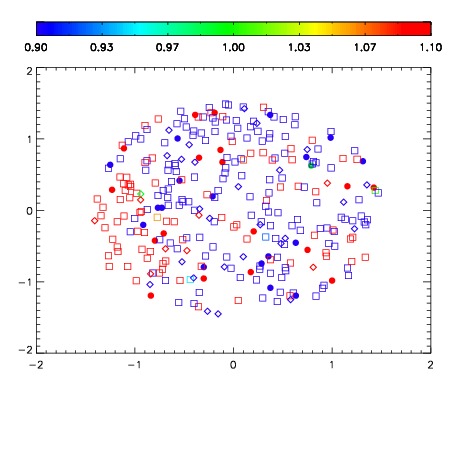
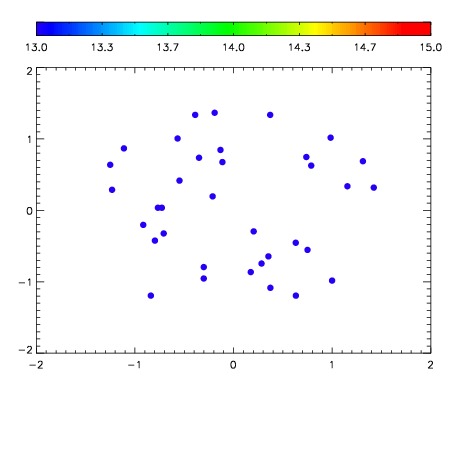

| Frame | Nreads | Zeropoints | Mag plots | Spatial mag deviation | Spatial sky 16325A emission deviations (filled: sky, open: star) | Spatial sky continuum emission | Spatial sky telluric CO2 absorption deviations (filled: H < 10) | |||||||||||||||||||||||
| 0 | 0 |
|
|
|
|
|
|
| IPAIR | NAME | SHIFT | NEWSHIFT | S/N | NAME | SHIFT | NEWSHIFT | S/N |
| 0 | 12510022 | 0.492157 | 0.00000 | 18.8871 | 12510023 | -0.00205119 | 0.494208 | 18.9343 |
| 1 | 12510026 | 0.490974 | 0.00118300 | 19.0295 | 12510027 | 0.000107868 | 0.492049 | 19.0023 |
| 2 | 12510025 | 0.490686 | 0.00147101 | 18.9334 | 12510024 | -0.00134227 | 0.493499 | 18.9523 |
| 3 | 12510021 | 0.491495 | 0.000661999 | 18.8704 | 12510020 | 0.00000 | 0.492157 | 18.8669 |