| Red | Green | Blue | |
| z | 17.64 | ||
| znorm | Inf | ||
| sky | -Inf | -Inf | -Inf |
| S/N | 26.7 | 44.4 | 47.1 |
| S/N(c) | 0.0 | 0.0 | 0.0 |
| SN(E/C) |

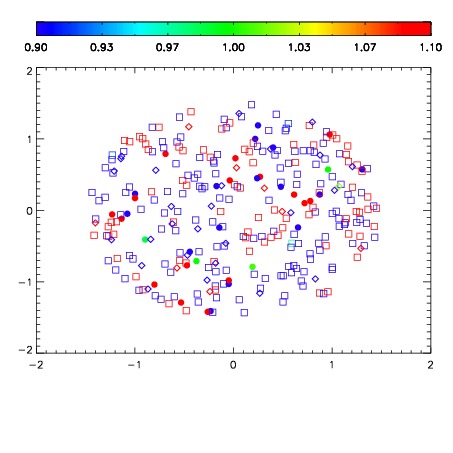


| Frame | Nreads | Zeropoints | Mag plots | Spatial mag deviation | Spatial sky 16325A emission deviations (filled: sky, open: star) | Spatial sky continuum emission | Spatial sky telluric CO2 absorption deviations (filled: H < 10) | |||||||||||||||||||||||
| 0 | 0 |
|
|
|
|
|
|
| IPAIR | NAME | SHIFT | NEWSHIFT | S/N | NAME | SHIFT | NEWSHIFT | S/N |
| 0 | 05180046 | 0.495210 | 0.00000 | 19.0166 | 05180048 | -0.00190538 | 0.497115 | 19.0249 |
| 1 | 05180050 | 0.491625 | 0.00358498 | 19.0721 | 05180051 | -0.00190112 | 0.497111 | 19.0792 |
| 2 | 05180049 | 0.492147 | 0.00306299 | 19.0378 | 05180047 | 1.93727e-05 | 0.495191 | 19.0385 |
| 3 | 05180045 | 0.493495 | 0.00171500 | 18.9138 | 05180044 | 0.00000 | 0.495210 | 18.9511 |