| Red | Green | Blue | |
| z | 17.64 | ||
| znorm | Inf | ||
| sky | -NaN | -NaN | -NaN |
| S/N | 27.3 | 44.5 | 47.8 |
| S/N(c) | 0.0 | 0.0 | 0.0 |
| SN(E/C) |
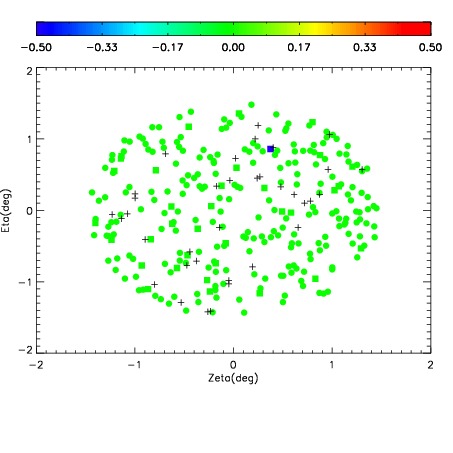
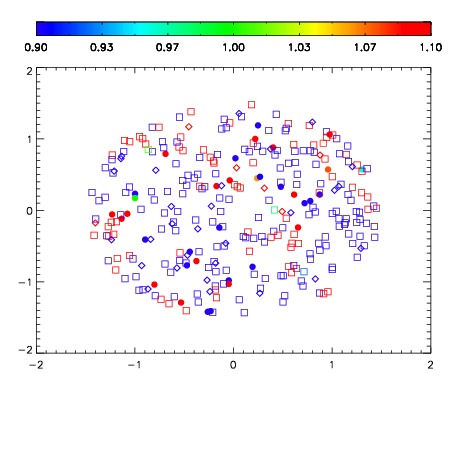


| Frame | Nreads | Zeropoints | Mag plots | Spatial mag deviation | Spatial sky 16325A emission deviations (filled: sky, open: star) | Spatial sky continuum emission | Spatial sky telluric CO2 absorption deviations (filled: H < 10) | |||||||||||||||||||||||
| 0 | 0 |
|
|
|
|
|
|
| IPAIR | NAME | SHIFT | NEWSHIFT | S/N | NAME | SHIFT | NEWSHIFT | S/N |
| 0 | 11780028 | 0.488123 | 0.00000 | 18.9892 | 11780026 | 0.00000 | 0.488123 | 18.9872 |
| 1 | 11780032 | 0.487132 | 0.000990987 | 19.1162 | 11780033 | -0.00226664 | 0.490390 | 19.1252 |
| 2 | 11780031 | 0.487337 | 0.000786006 | 19.1139 | 11780030 | -0.00168592 | 0.489809 | 19.0538 |
| 3 | 11780027 | 0.487673 | 0.000449985 | 18.9984 | 11780029 | -0.00202597 | 0.490149 | 19.0479 |