| Red | Green | Blue | |
| z | 17.64 | ||
| znorm | Inf | ||
| sky | -Inf | -NaN | -NaN |
| S/N | 29.4 | 50.6 | 53.8 |
| S/N(c) | 0.0 | 0.0 | 0.0 |
| SN(E/C) |
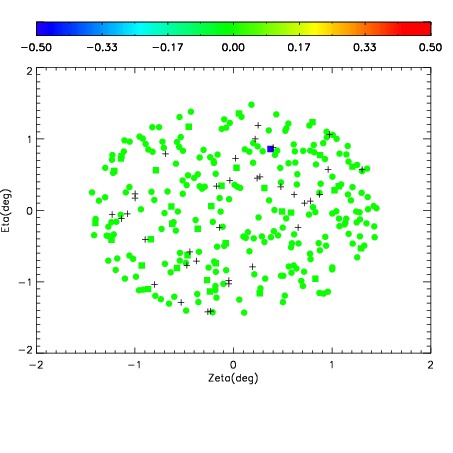
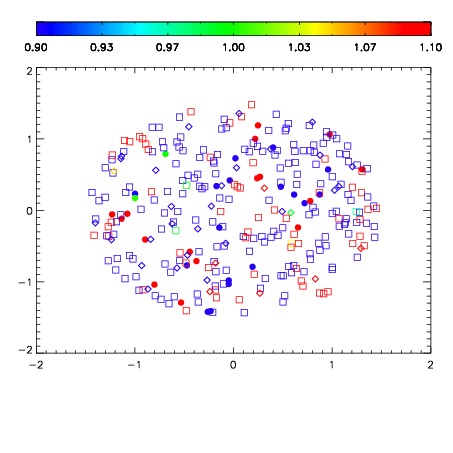


| Frame | Nreads | Zeropoints | Mag plots | Spatial mag deviation | Spatial sky 16325A emission deviations (filled: sky, open: star) | Spatial sky continuum emission | Spatial sky telluric CO2 absorption deviations (filled: H < 10) | |||||||||||||||||||||||
| 0 | 0 |
|
|
|
|
|
|
| IPAIR | NAME | SHIFT | NEWSHIFT | S/N | NAME | SHIFT | NEWSHIFT | S/N |
| 0 | 11860077 | 0.491546 | 0.00000 | 18.9637 | 11860076 | 0.00000 | 0.491546 | 18.9573 |
| 1 | 11860085 | 0.488169 | 0.00337699 | 19.0782 | 11860084 | -0.00369340 | 0.495239 | 19.0822 |
| 2 | 11860081 | 0.489320 | 0.00222600 | 19.0430 | 11860079 | -0.00360540 | 0.495151 | 19.0165 |
| 3 | 11860078 | 0.491375 | 0.000171006 | 19.0141 | 11860083 | -0.00372048 | 0.495266 | 18.9947 |
| 4 | 11860082 | 0.489003 | 0.00254300 | 19.0038 | 11860080 | -0.00359780 | 0.495144 | 18.9936 |