| Red | Green | Blue | |
| z | 17.64 | ||
| znorm | Inf | ||
| sky | -Inf | -NaN | -Inf |
| S/N | 28.5 | 48.7 | 52.2 |
| S/N(c) | 0.0 | 0.0 | 0.0 |
| SN(E/C) |


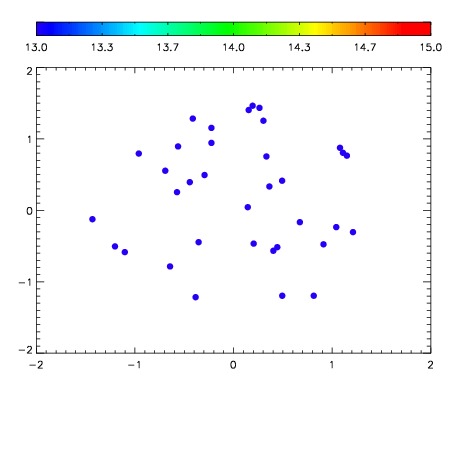

| Frame | Nreads | Zeropoints | Mag plots | Spatial mag deviation | Spatial sky 16325A emission deviations (filled: sky, open: star) | Spatial sky continuum emission | Spatial sky telluric CO2 absorption deviations (filled: H < 10) | |||||||||||||||||||||||
| 0 | 0 |
|
|
|
|
|
|
| IPAIR | NAME | SHIFT | NEWSHIFT | S/N | NAME | SHIFT | NEWSHIFT | S/N |
| 0 | 10060016 | 0.478551 | 0.00000 | 19.1864 | 10060017 | 0.00217665 | 0.476374 | 19.1281 |
| 1 | 10060015 | 0.477731 | 0.000820011 | 19.1869 | 10060014 | 0.00111685 | 0.477434 | 19.1599 |
| 2 | 10060011 | 0.475589 | 0.00296199 | 19.0916 | 10060013 | 0.00135678 | 0.477194 | 19.1198 |
| 3 | 10060012 | 0.476429 | 0.00212201 | 19.0894 | 10060010 | 0.00000 | 0.478551 | 19.0668 |