| Red | Green | Blue | |
| z | 17.64 | ||
| znorm | Inf | ||
| sky | -Inf | -Inf | -Inf |
| S/N | 26.0 | 44.2 | 48.1 |
| S/N(c) | 0.0 | 0.0 | 0.0 |
| SN(E/C) |
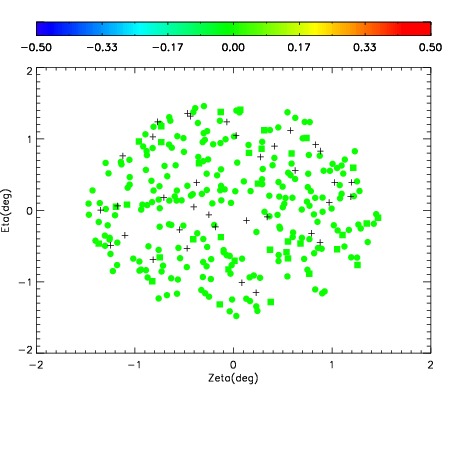
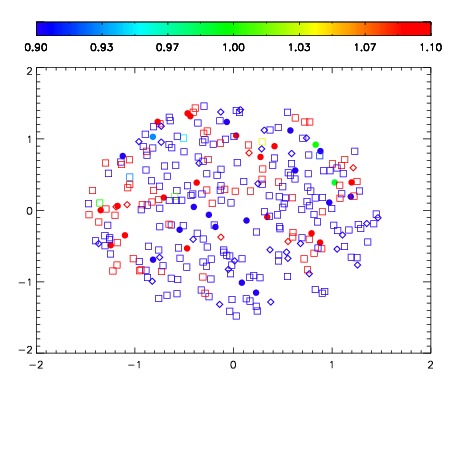


| Frame | Nreads | Zeropoints | Mag plots | Spatial mag deviation | Spatial sky 16325A emission deviations (filled: sky, open: star) | Spatial sky continuum emission | Spatial sky telluric CO2 absorption deviations (filled: H < 10) | |||||||||||||||||||||||
| 0 | 0 |
|
|
|
|
|
|
| IPAIR | NAME | SHIFT | NEWSHIFT | S/N | NAME | SHIFT | NEWSHIFT | S/N |
| 0 | 10070015 | 0.466477 | 0.00000 | 19.0629 | 10070013 | 0.00000 | 0.466477 | 19.0777 |
| 1 | 10070019 | 0.466273 | 0.000203997 | 19.1065 | 10070020 | 0.00103086 | 0.465446 | 19.1070 |
| 2 | 10070018 | 0.465829 | 0.000647992 | 19.0443 | 10070016 | 0.00202430 | 0.464453 | 19.0639 |
| 3 | 10070014 | 0.465676 | 0.000800997 | 19.0409 | 10070017 | 0.00171725 | 0.464760 | 18.9495 |