| Red | Green | Blue | |
| z | 17.64 | ||
| znorm | Inf | ||
| sky | -NaN | -NaN | -Inf |
| S/N | 26.6 | 45.1 | 50.5 |
| S/N(c) | 0.0 | 0.0 | 0.0 |
| SN(E/C) |
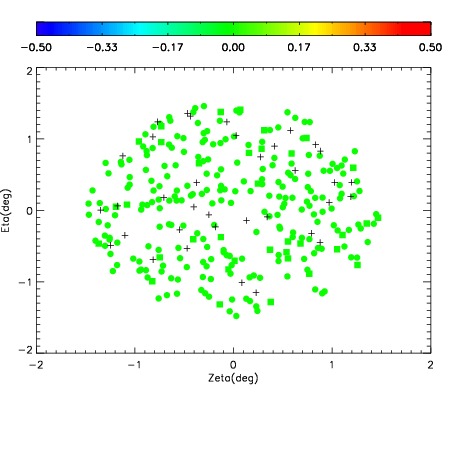
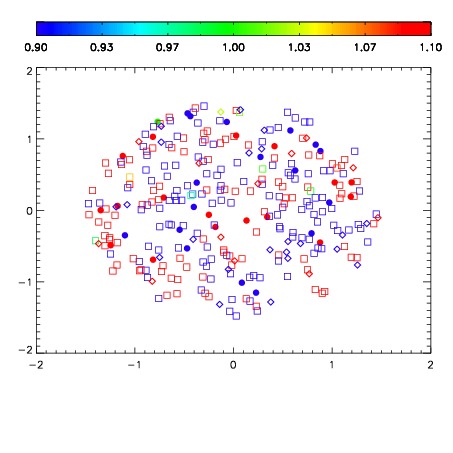
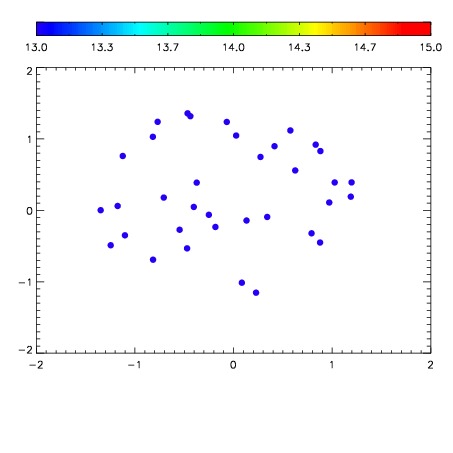

| Frame | Nreads | Zeropoints | Mag plots | Spatial mag deviation | Spatial sky 16325A emission deviations (filled: sky, open: star) | Spatial sky continuum emission | Spatial sky telluric CO2 absorption deviations (filled: H < 10) | |||||||||||||||||||||||
| 0 | 0 |
|
|
|
|
|
|
| IPAIR | NAME | SHIFT | NEWSHIFT | S/N | NAME | SHIFT | NEWSHIFT | S/N |
| 0 | 10110017 | 0.510869 | 0.00000 | 19.0721 | 10110015 | 0.00344529 | 0.507424 | 19.1289 |
| 1 | 10110012 | 0.506419 | 0.00445002 | 19.1871 | 10110011 | 0.00000 | 0.510869 | 19.1573 |
| 2 | 10110013 | 0.506892 | 0.00397700 | 19.1675 | 10110018 | 0.00356249 | 0.507307 | 19.1358 |
| 3 | 10110016 | 0.510303 | 0.000566006 | 19.0834 | 10110014 | 0.00314891 | 0.507720 | 19.1328 |