| Red | Green | Blue | |
| z | 17.64 | ||
| znorm | Inf | ||
| sky | -Inf | -NaN | -Inf |
| S/N | 11.1 | 19.0 | 18.2 |
| S/N(c) | 0.0 | 0.0 | 0.0 |
| SN(E/C) |

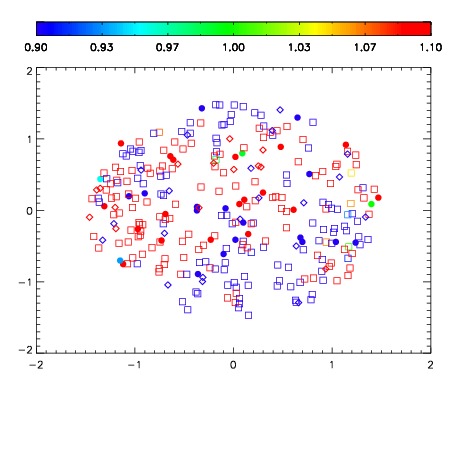
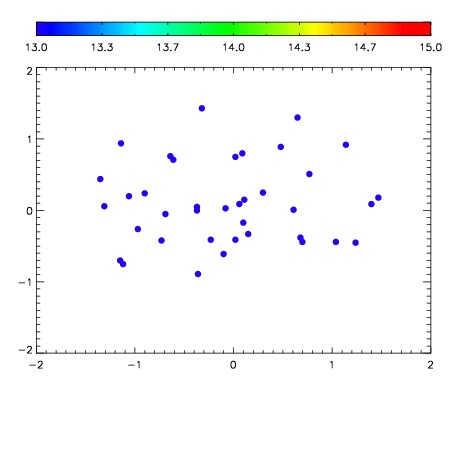

| Frame | Nreads | Zeropoints | Mag plots | Spatial mag deviation | Spatial sky 16325A emission deviations (filled: sky, open: star) | Spatial sky continuum emission | Spatial sky telluric CO2 absorption deviations (filled: H < 10) | |||||||||||||||||||||||
| 0 | 0 |
|
|
|
|
|
|
| IPAIR | NAME | SHIFT | NEWSHIFT | S/N | NAME | SHIFT | NEWSHIFT | S/N |
| 0 | 12120012 | 0.494978 | 0.00000 | 16.0810 | 12120011 | 0.00000 | 0.494978 | 17.3992 |
| 1 | 12120017 | 0.492902 | 0.00207600 | 18.0973 | 12120018 | -0.00252485 | 0.497503 | 18.2333 |
| 2 | 12120016 | 0.493117 | 0.00186101 | 17.9830 | 12120015 | -0.00215011 | 0.497128 | 17.8347 |
| 3 | 12120013 | 0.494711 | 0.000266999 | 16.7980 | 12120014 | -0.00213270 | 0.497111 | 17.4864 |