| Red | Green | Blue | |
| z | 17.64 | ||
| znorm | Inf | ||
| sky | -NaN | -NaN | -NaN |
| S/N | 28.0 | 45.4 | 40.7 |
| S/N(c) | 0.0 | 0.0 | 0.0 |
| SN(E/C) |
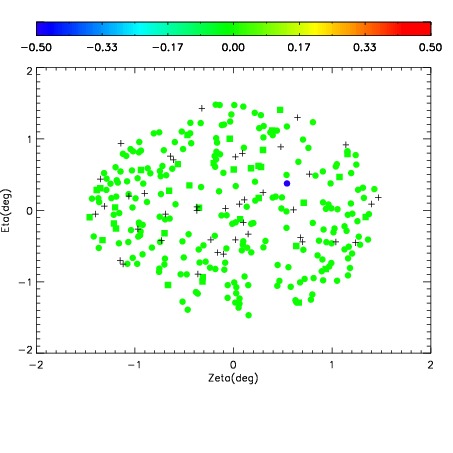
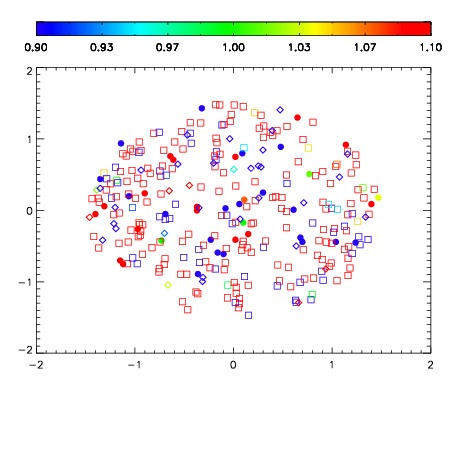
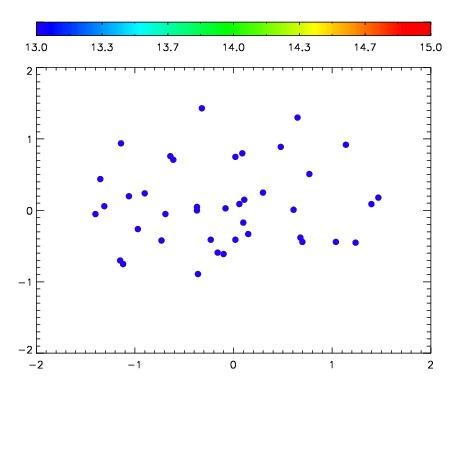

| Frame | Nreads | Zeropoints | Mag plots | Spatial mag deviation | Spatial sky 16325A emission deviations (filled: sky, open: star) | Spatial sky continuum emission | Spatial sky telluric CO2 absorption deviations (filled: H < 10) | |||||||||||||||||||||||
| 0 | 0 |
|
|
|
|
|
|
| IPAIR | NAME | SHIFT | NEWSHIFT | S/N | NAME | SHIFT | NEWSHIFT | S/N |
| 0 | 12180023 | 0.491331 | 0.00000 | 18.9368 | 12180022 | 0.00000 | 0.491331 | 18.8913 |
| 1 | 12180027 | 0.489743 | 0.00158802 | 18.9753 | 12180025 | -0.00472678 | 0.496058 | 19.0057 |
| 2 | 12180024 | 0.491149 | 0.000182003 | 18.9684 | 12180026 | -0.00513716 | 0.496468 | 18.9981 |
| 3 | 12180028 | 0.490440 | 0.000891000 | 18.9432 | 12180029 | -0.00692129 | 0.498252 | 18.9541 |