| Red | Green | Blue | |
| z | 17.64 | ||
| znorm | Inf | ||
| sky | -NaN | -Inf | -Inf |
| S/N | 10.3 | 18.1 | 17.9 |
| S/N(c) | 0.0 | 0.0 | 0.0 |
| SN(E/C) |

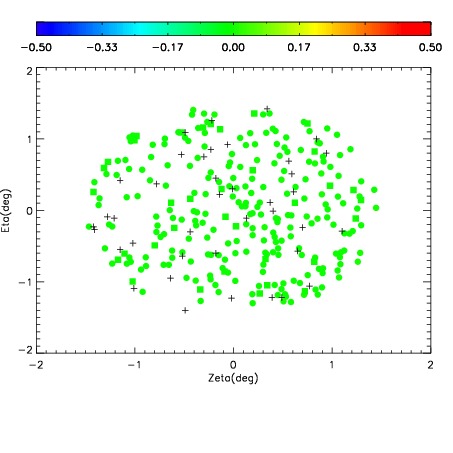
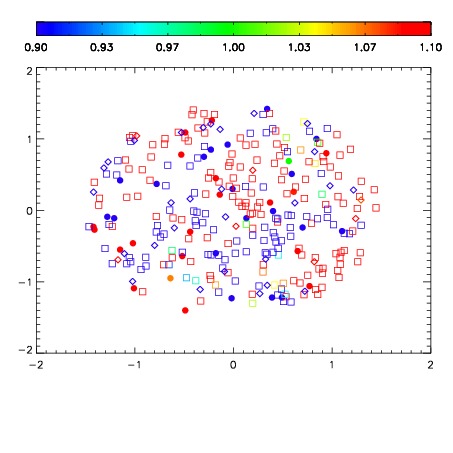


| Frame | Nreads | Zeropoints | Mag plots | Spatial mag deviation | Spatial sky 16325A emission deviations (filled: sky, open: star) | Spatial sky continuum emission | Spatial sky telluric CO2 absorption deviations (filled: H < 10) | |||||||||||||||||||||||
| 0 | 0 |
|
|
|
|
|
|
| IPAIR | NAME | SHIFT | NEWSHIFT | S/N | NAME | SHIFT | NEWSHIFT | S/N |
| 0 | 12590019 | 0.484659 | 0.00000 | 17.9555 | 12590017 | -0.00400787 | 0.488667 | 17.6929 |
| 1 | 12590018 | 0.484617 | 4.19915e-05 | 18.0478 | 12590020 | -0.00156279 | 0.486222 | 17.9422 |
| 2 | 12590014 | 0.481264 | 0.00339499 | 17.4779 | 12590016 | -0.00342330 | 0.488082 | 17.6738 |
| 3 | 12590015 | 0.482973 | 0.00168598 | 17.4232 | 12590013 | 0.00000 | 0.484659 | 17.5070 |