| Red | Green | Blue | |
| z | 17.64 | ||
| znorm | Inf | ||
| sky | -NaN | -Inf | -Inf |
| S/N | 22.6 | 34.3 | 34.9 |
| S/N(c) | 0.0 | 0.0 | 0.0 |
| SN(E/C) |
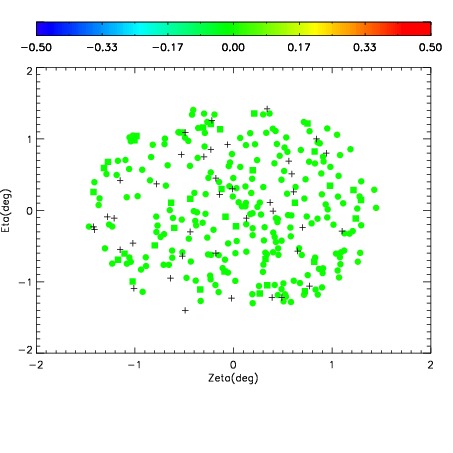
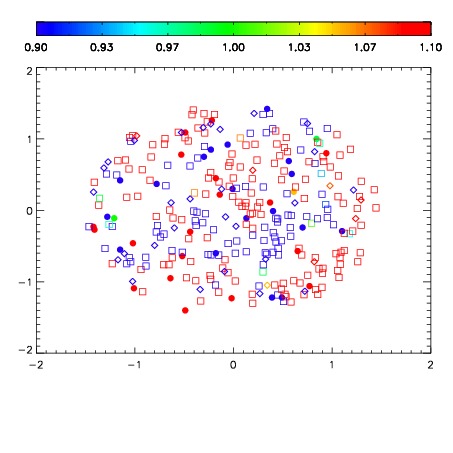


| Frame | Nreads | Zeropoints | Mag plots | Spatial mag deviation | Spatial sky 16325A emission deviations (filled: sky, open: star) | Spatial sky continuum emission | Spatial sky telluric CO2 absorption deviations (filled: H < 10) | |||||||||||||||||||||||
| 0 | 0 |
|
|
|
|
|
|
| IPAIR | NAME | SHIFT | NEWSHIFT | S/N | NAME | SHIFT | NEWSHIFT | S/N |
| 0 | 12610044 | 0.489338 | 0.00000 | 18.7710 | 12610041 | -0.00359101 | 0.492929 | 18.7441 |
| 1 | 12610043 | 0.488528 | 0.000809997 | 18.8022 | 12610045 | -0.000668163 | 0.490006 | 18.7893 |
| 2 | 12610039 | 0.486603 | 0.00273502 | 18.7529 | 12610042 | -0.00388731 | 0.493225 | 18.7245 |
| 3 | 12610040 | 0.486603 | 0.00273502 | 18.7436 | 12610038 | 0.00000 | 0.489338 | 18.6918 |