| Red | Green | Blue | |
| z | 17.64 | ||
| znorm | Inf | ||
| sky | -Inf | -Inf | -Inf |
| S/N | 17.7 | 29.8 | 29.7 |
| S/N(c) | 0.0 | 0.0 | 0.0 |
| SN(E/C) |
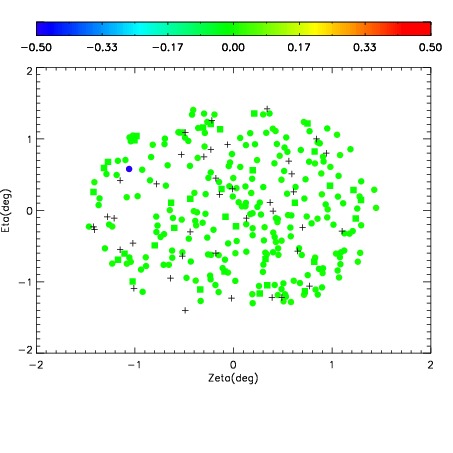
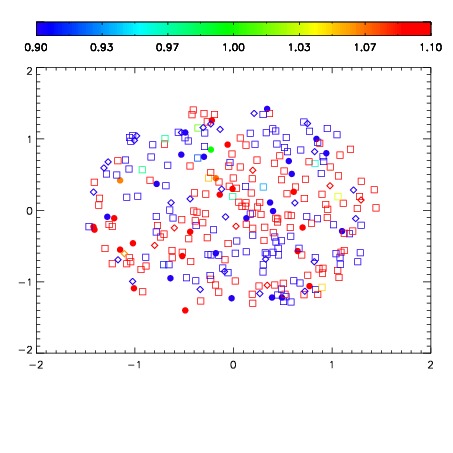
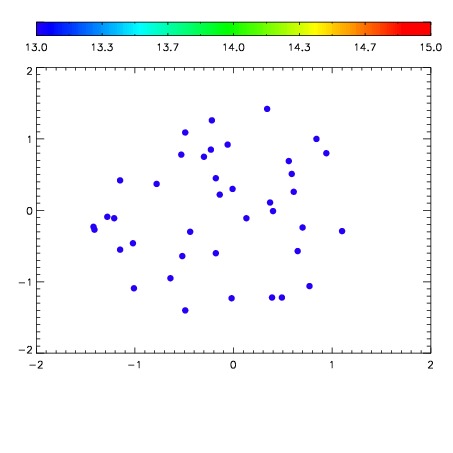

| Frame | Nreads | Zeropoints | Mag plots | Spatial mag deviation | Spatial sky 16325A emission deviations (filled: sky, open: star) | Spatial sky continuum emission | Spatial sky telluric CO2 absorption deviations (filled: H < 10) | |||||||||||||||||||||||
| 0 | 0 |
|
|
|
|
|
|
| IPAIR | NAME | SHIFT | NEWSHIFT | S/N | NAME | SHIFT | NEWSHIFT | S/N |
| 0 | 12680032 | 0.490712 | 0.00000 | 18.5173 | 12680033 | 0.000938002 | 0.489774 | 18.4951 |
| 1 | 12680031 | 0.490513 | 0.000198990 | 18.5045 | 12680026 | 0.00000 | 0.490712 | 18.4750 |
| 2 | 12680027 | 0.489765 | 0.000946999 | 18.4340 | 12680029 | -0.000381500 | 0.491093 | 18.4723 |
| 3 | 12680028 | 0.490452 | 0.000259995 | 18.4137 | 12680030 | 0.000380709 | 0.490331 | 18.3984 |