| Red | Green | Blue | |
| z | 17.64 | ||
| znorm | Inf | ||
| sky | -Inf | -NaN | -Inf |
| S/N | 12.8 | 20.6 | 19.2 |
| S/N(c) | 0.0 | 0.0 | 0.0 |
| SN(E/C) |
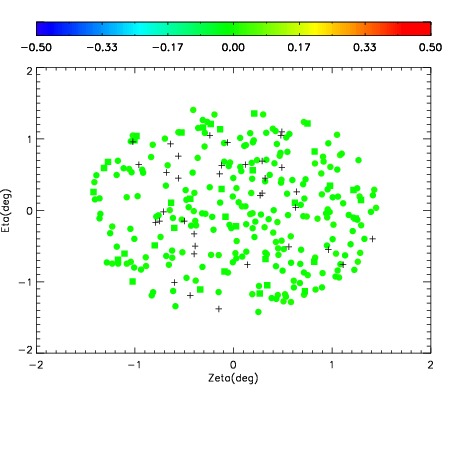
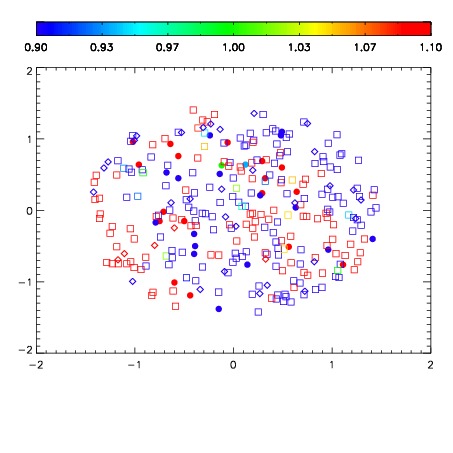
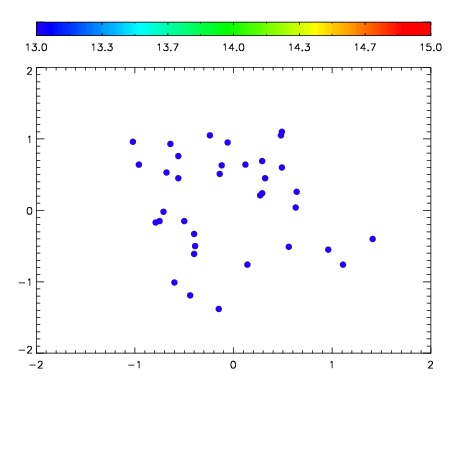

| Frame | Nreads | Zeropoints | Mag plots | Spatial mag deviation | Spatial sky 16325A emission deviations (filled: sky, open: star) | Spatial sky continuum emission | Spatial sky telluric CO2 absorption deviations (filled: H < 10) | |||||||||||||||||||||||
| 0 | 0 |
|
|
|
|
|
|
| IPAIR | NAME | SHIFT | NEWSHIFT | S/N | NAME | SHIFT | NEWSHIFT | S/N |
| 0 | 12320049 | 0.492623 | 0.00000 | 18.5321 | 12320051 | 0.000159123 | 0.492464 | 18.5156 |
| 1 | 12320050 | 0.492061 | 0.000562012 | 18.2798 | 12320048 | -0.000936334 | 0.493559 | 18.4290 |
| 2 | 12320046 | 0.491015 | 0.00160801 | 16.7903 | 12320047 | -0.00212549 | 0.494749 | 17.8079 |
| 3 | 12320045 | 0.490988 | 0.00163502 | 16.2757 | 12320044 | 0.00000 | 0.492623 | 16.7603 |