| Red | Green | Blue | |
| z | 17.64 | ||
| znorm | Inf | ||
| sky | -Inf | -Inf | -Inf |
| S/N | 21.9 | 37.5 | 37.2 |
| S/N(c) | 0.0 | 0.0 | 0.0 |
| SN(E/C) |
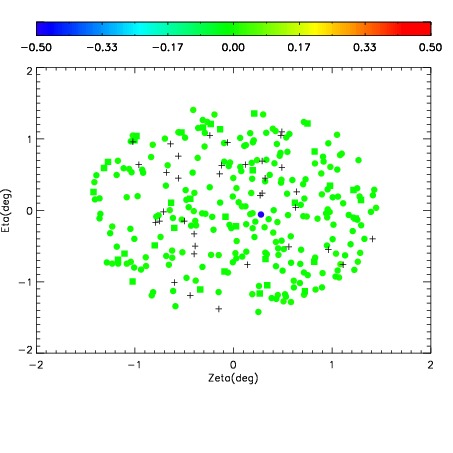
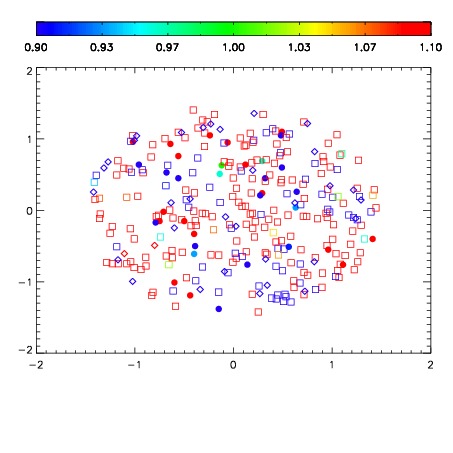


| Frame | Nreads | Zeropoints | Mag plots | Spatial mag deviation | Spatial sky 16325A emission deviations (filled: sky, open: star) | Spatial sky continuum emission | Spatial sky telluric CO2 absorption deviations (filled: H < 10) | |||||||||||||||||||||||
| 0 | 0 |
|
|
|
|
|
|
| IPAIR | NAME | SHIFT | NEWSHIFT | S/N | NAME | SHIFT | NEWSHIFT | S/N |
| 0 | 12500028 | 0.495399 | 0.00000 | 18.7851 | 12500033 | 0.000672213 | 0.494727 | 18.8235 |
| 1 | 12500027 | 0.494120 | 0.00127900 | 18.7368 | 12500029 | 0.000430423 | 0.494969 | 18.7488 |
| 2 | 12500031 | 0.494313 | 0.00108600 | 18.7245 | 12500030 | 0.000748185 | 0.494651 | 18.7266 |
| 3 | 12500032 | 0.494918 | 0.000481009 | 18.7122 | 12500026 | 0.00000 | 0.495399 | 18.4981 |